Properly Analyzing the IRR in Real Estate Investing
The internal rate of return (IRR) is the preferred return metric in commercial real estate investment analysis. This calculation allows real estate investors to compare multiple investments of varying sizes and objectively evaluate these investment opportunities. Thanks to technology, specifically Microsoft Excel, the IRR can be calculated relatively easily by calling on the IRR formula and selecting the cash flows over a specified period.
IRR Analysis Contents
What is the IRR in Real Estate Investing?
The IRR is a total return metric that considers the time value of money (TVM). Unlike the equity multiple or a basic ROI calculation, the IRR is presented as a percentage return annually. The IRR financial metric is extremely sensitive to cash flow timing, and long-term investments tend to deflate the IRR as TVM is much more impactful over larger time horizons. For a more precise measurement of inconsistent distributions, you may consider the XIRR.
What Constitutes a Real Estate IRR
In a levered real estate investment, IRR is a calculation of annualized total return derived from five different sources:
Initial Investment Recovery
Year 1 Cash Flow
Cash Flow Increases Year-over-Year
Principal Loan Balance Reduction
Initial Investment Recovery
The most critical factor in achieving an IRR threshold is recuperating the initial equity invested when the deal is sold. If this doesn't happen, it will be impossible to hit a respectable IRR. The initial investment is your down payment.
Year 1 Cash Flow
What is the cash flow during the first year of the proforma? Cash flow means:
NOI - Debt Service - Capital Expenditures
Cash Flow Increases
How much does cash flow increase year over year? Cash flow increases are calculated by:
Year “x” Cash Flow - Year 1 Cash Flow
Appreciation
Investment appreciation will depend on cash flow increases and the residual cap rate assumption. It is defined as:
Residual Sale Price - Sale Costs - Total Uses
Uses include the property price, financing costs, closing costs, capital expenditures (raised on the front end), and acquisition fees (for syndicators).
Principal Loan Balance Reduction
Paying debt service reduces principal paydown when the investment is sold. This reduction is defined as:
Initial Loan Amount - Loan Balance at Sale
Real Estate IRR Model Example #1
A beneficial exercise measures the percentage of the total IRR of the five sources, as mentioned earlier. This is best taught with an IRR analysis example.
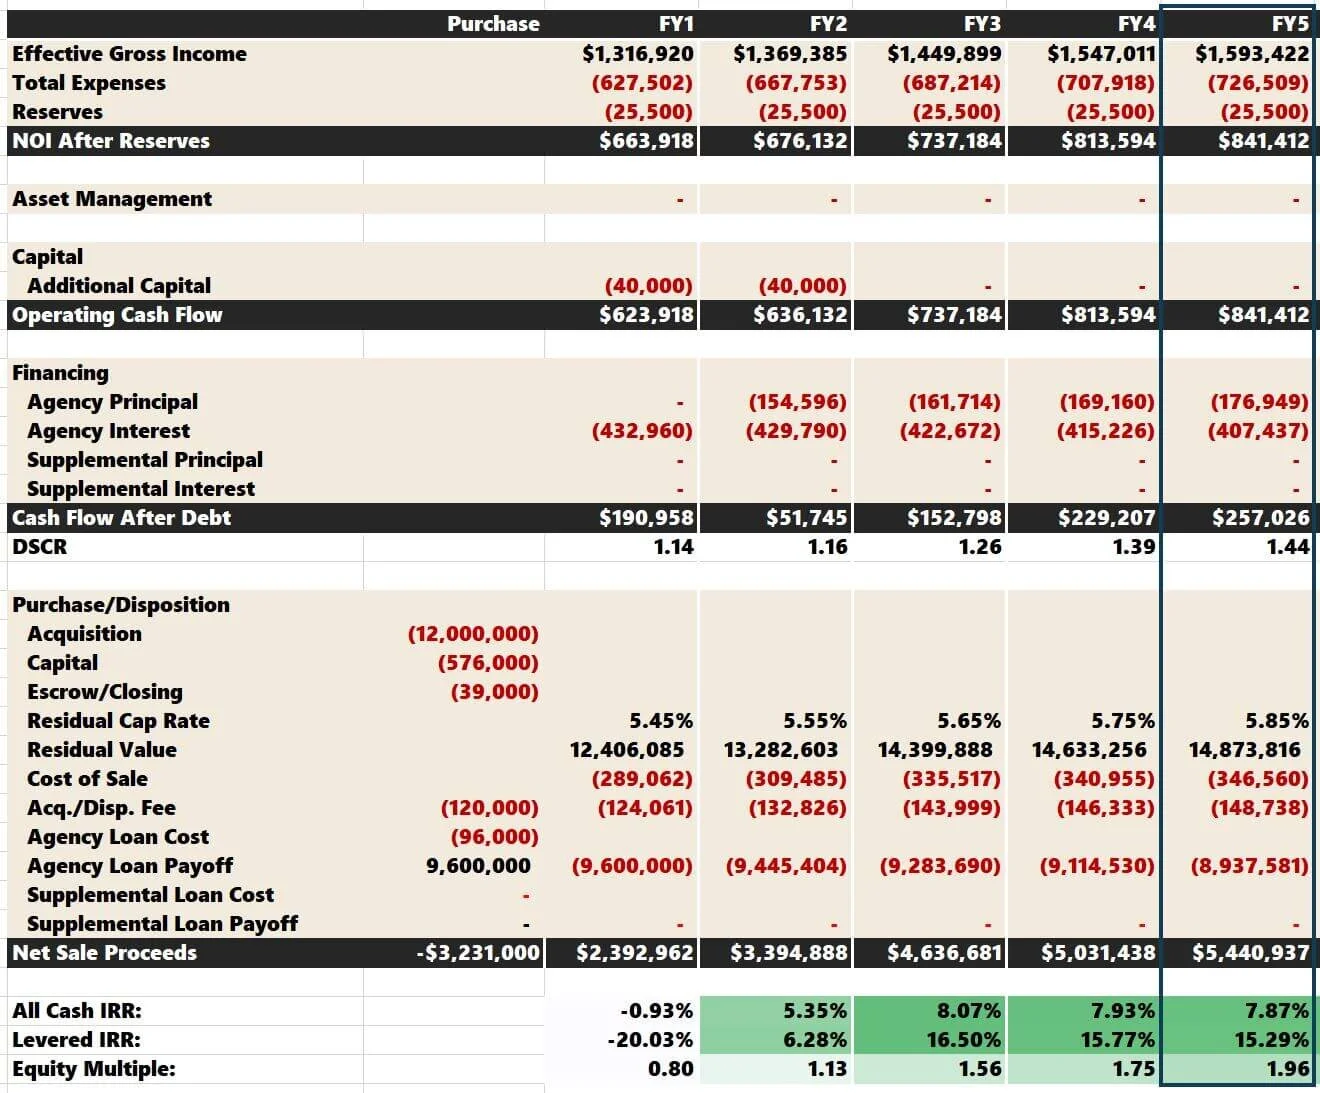
Let’s use an example multifamily project that has the following cash flows over a five-year hold:

Microsoft Excel’s IRR calculator would tell you that the leveraged IRR is 15.29%.
Initial Investment Recovery
The first calculation is to take the present value (PV) of the initial cash put into the project, or $3,811,000.
Our discount rate will be the project’s IRR, which is 15.29%. Our holding period is five years.
In Excel, The PV calculation arguments are:
N: 5
I/Y: 15.29%%
PMT: 0
FV: $3,811,000
PV = $1,871,422
The PV of returning the initial investment of $3,811,00 in five years is $1,871,422. Stated differently, receiving $3,811,000 in five years from now will only be worth $1,871,422 when discounted at the IRR.
I have built these calculations into an independent IRR analysis financial model, and the PV result can be seen in “row 0.”

Year 1 Cash Flow
The next step is calculating the net present value (NPV) for the Year 1 cash flow. The first-year cash flow needs to be projected across all five years. Year 1 cash flow is $70,198.
The NPV is again calculated in “row “0”. The arguments in the NPV calculation are the same as before.
Discount Rate = IRR = 15.29%. Because the NPV formula requires you to select all the cash flows, Excel’s IRR calculator will deduce that the term is five years.

NPV = $233,736
Cash Flow Increases
Now, it's time to calculate the NPV of the increases in cash flow over the five-year term. Again, the discount rate is 15.29%.
Year 1 = $0 ($70,198 - $70,198)
Year 2 = $50,325 ($120,525 - $70,198)
Year 3 = $151,377 ($221,576 - $70,198)
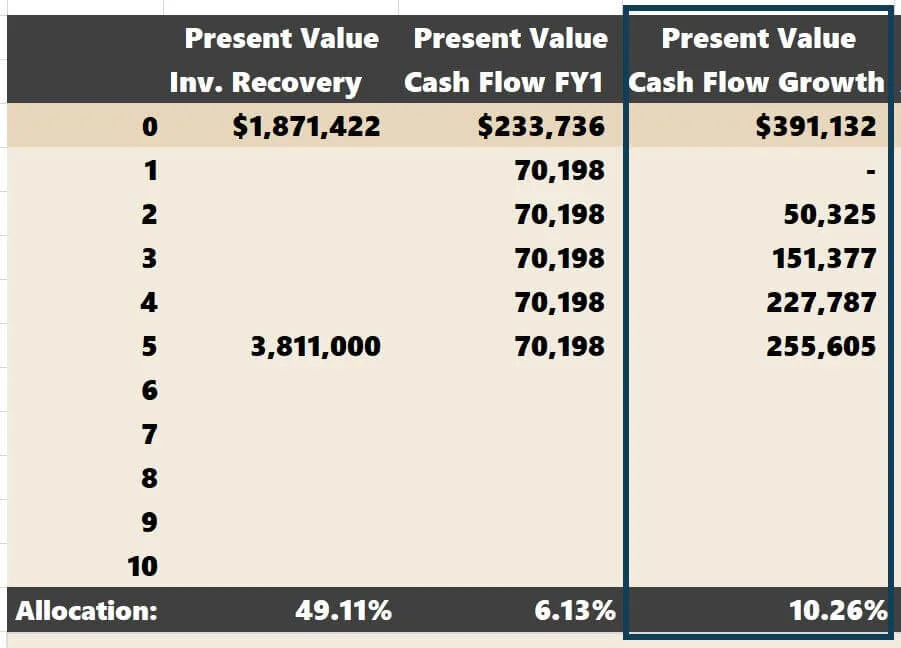
The NPV of cash flow growth is $391,132.
Appreciation
For appreciation, another PV calculation is needed. To refresh, below are the projected cash flows.

Appreciation is calculated by taking the residual sales price minus closing costs minus total sources:
$15,132,491 - 352,587 - 151,325 - $12,811,000 = $1,817,579.
Total Uses consist of:
Acquisition Price: $12,000,000
Capital For Renovations: $576,000
Escrow/Closing: $25,000
Acquisition Fee: $120,000
Loan Cost: $90,000
Total: $12,811,000
What is the value of appreciation worth when discounted at 15.29% over five years?

The PV arguments are:
N: 5
I/Y: 15.29%
PMT: 0
FV: $1,817,579
PV = $892,536
Principal Reduction of Debt
The final question is how much principal was paid down over the five-year term and the PV of that amount.

Principal Paydown:
Initial Loan Amount – Loan Amount at Sale:
$9,000,000 - $8,140,276 = $859,724

The PV arguments are:
N: 5
I/Y: 15.29%
PMT: 0
FV: $859,724
PV = $422,174
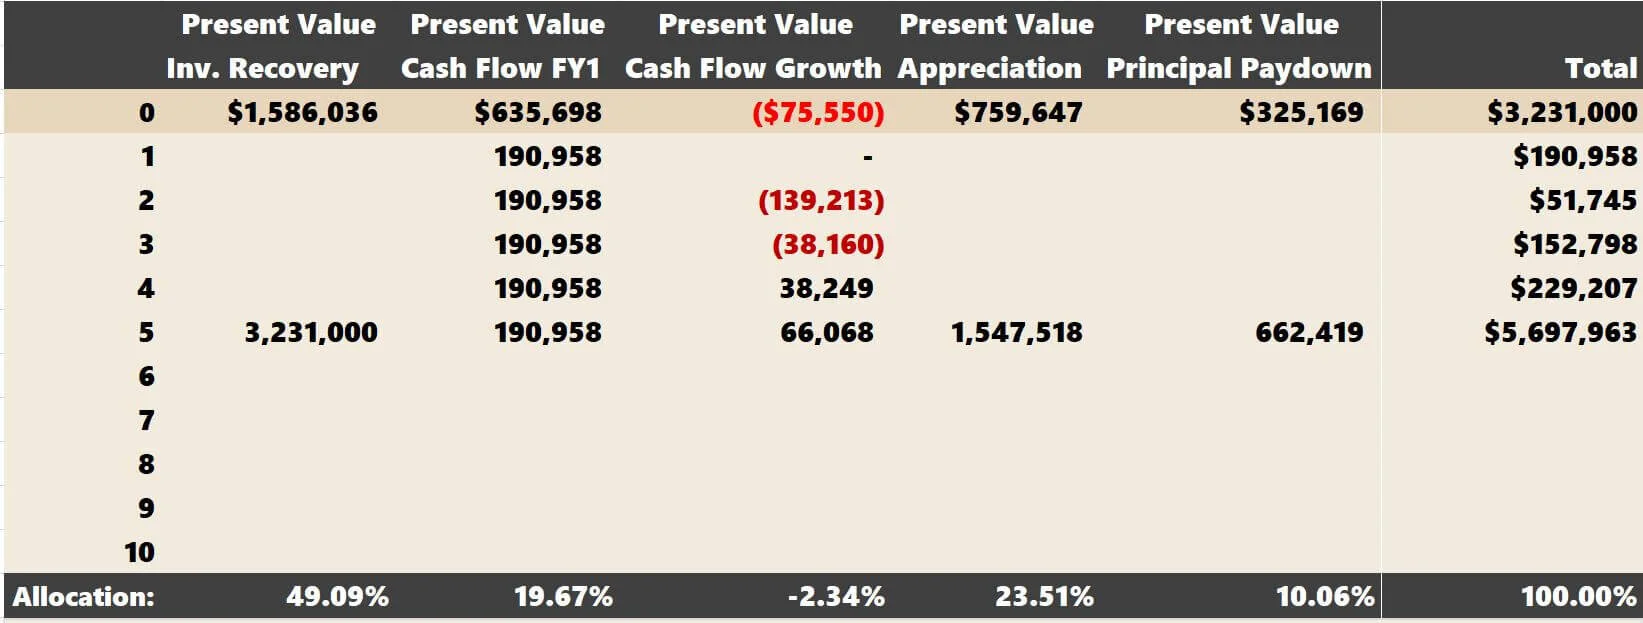
IRR Model Observations
Now we can see what role each of the five sources has in the aggregate IRR.

Something you should pay attention to:
Present Value of all five sources = $3,811,000, the total equity investment in the deal (seen across “row 0”).
The allocation calculation in the bottom row takes the PV displayed in “row 0” and divides it by the total equity investment ($3,811,000)
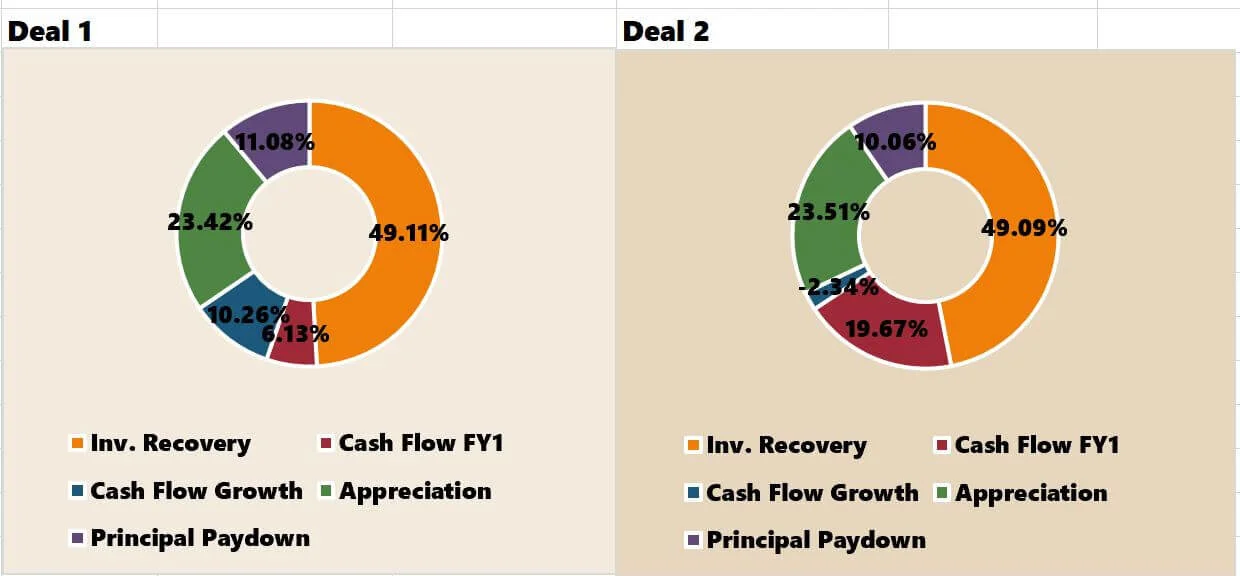
The calculation of the “PV of Investment Recovery” is $1,871,422 / $3,811,000 = 49.11%.
The calculation of the “PV of Cash Flow 1” is $233,736 / $3,811,000 = 6.13%.
Always make sure that the aggregate of all five allocations equals 100%
Below is a pie chart displaying each source’s role in the aggregate 15.29% IRR.
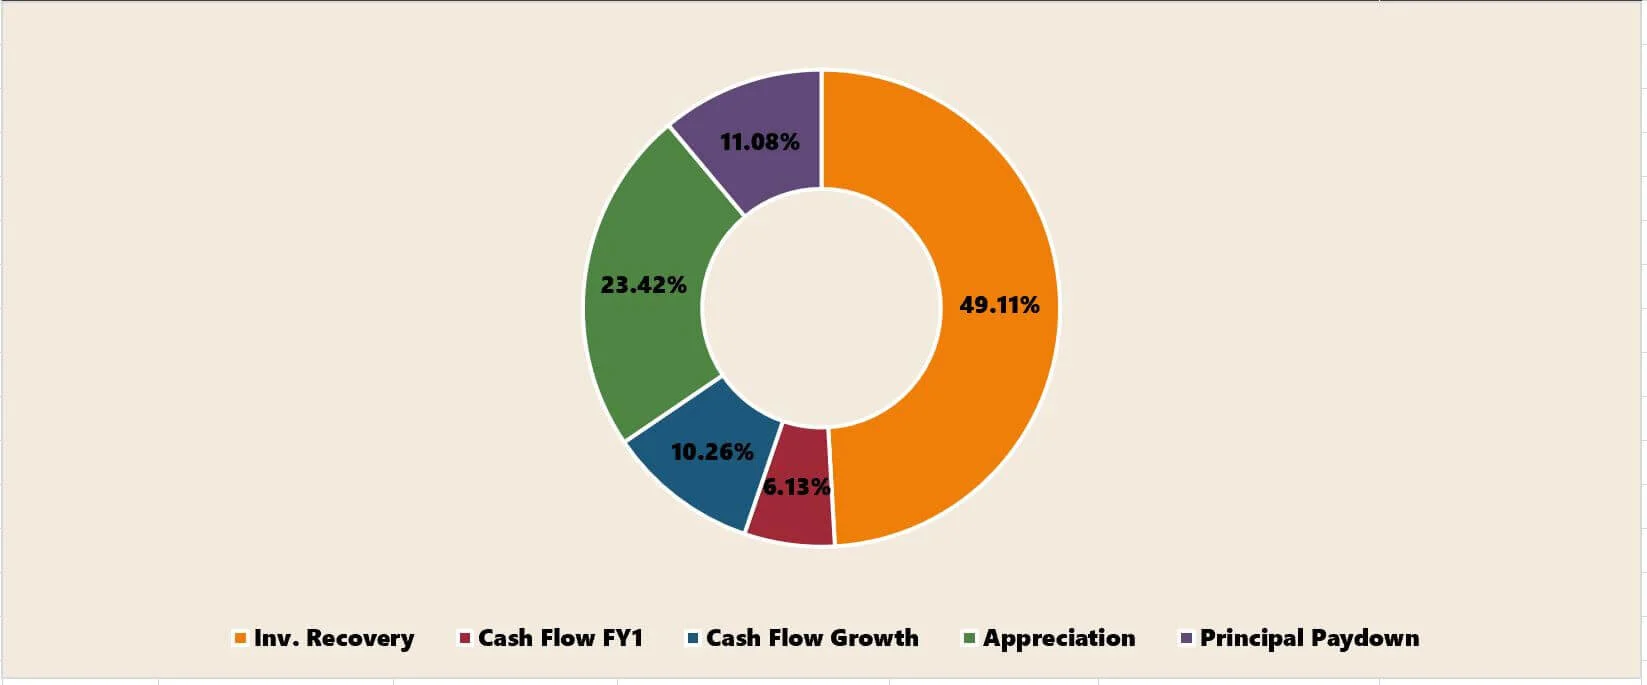
Leveraged IRR Allocations
This exercise will become exponentially more valuable as you look at more deals and record the allocations off IRR for each one. Patterns will emerge, which will help you decide whether a deal meets your risk thresholds. I hope this exercise can be used with other metrics to provide a more sound analysis overall.
Here are a few things I have noticed over the years:
“Recovering the Initial Investment” and “Cash Flow Year 1” should be thought of as “easier” metrics to achieve. Why would you invest in a deal if you didn’t expect to get your initial investment back? Your cash flow in year one should be easy to underwrite if you are reasonable with your underwriting assumptions.
It’s paradoxical in nature because if you happen to miss these two assumptions, your investment has no chance of being successful. Deals that do not have much operating upside (think multifamily development) will often have the bulk of the IRR coming from “Recovering Initial Investment” and “Appreciation.” In my opinion, this is dangerous. The residual cap rate is often counted on to get the initial equity out of the deal at the sale.
I would never buy a deal that has limited upside beyond Year 1. If you cannot recoup your initial investment, the investment is a lemon. It’s as simple as that. Always make sure that you are confident that even in a down real estate market, you could get your equity out if you decide to sell.
Real Estate IRR Model Example #2
Below is a different deal with a separate IRR model that returns an identical 15.29% IRR.
This is how the IRR allocation unfolds when holding for the same five-year time frame:
Both scenarios are inherently risky given the nature of a short-term hold with fairly extensive value-add upside. The second scenario is more levered (80% vs. the 75% LTV used in the first example). The second scenario also has 12 months of interest-only financing, which skews “Year 1 Cash Flow” higher. You can see in future years. Cash flow growth is negative once the principal payments kick in!
IRR Model Comparison
Overall, the willingness to hold an asset long term should help to distribute percentages over the five IRR sources more evenly. This is how the pie chart shifts in Deal 1 with a 10-year investment hold.

You wouldn’t put all your life savings into one stock to secure your financial future. The same rationale could be used with IRR sources. Spreading the IRR over more sources is akin to diversification. You want your eggs in multiple IRR baskets, which will hedge your investment if the market worsens. Holding a property longer will help smooth over the IRR sources.
Related: It’s also helpful to compare the “levered” IRR to the “unlevered” IRR.
Video: IRR Sources
Summarizing the IRR in Real Estate
The IRR metric measures total return while considering the time value of money (TVM). The IRR is much more comprehensive than yield metrics like cap rates, cash-on-cash return, or yield on cost. The IRR is sensitive to cash flow timing, and long-term investments tend to decrease the IRR as TVM is more prevalent.
If you like this analysis, you must utilize it in all of your prospective deals. For this exercise, more volume adds more value. You can compare future investments with past projects you have analyzed and purchased. Use the properties that had performed exceptionally well, note the IRR allocations when you initially underwrote them, and set them as your benchmark when searching for your subsequent acquisition.
If you want to analyze this metric for every investment opportunity, don’t forget to check out our Value-Add Model.
You can also learn how to calculate IRR Source for a Multifamily Development.


