Public REITs vs. Private Real Estate Investment
This article was originally written in May 2022 and updated in February 2024. I left the original NAV analysis untouched.
Most aspiring real estate investors want to get their hands dirty and own their real estate assets outright. Or, at the very least, invest funds directly with a trusted general partner in a private real estate (syndication) project and claim an equity stake that way.
As someone active in the commercial real estate realm, anecdotally, all the success stories I hear come directly from the front lines of real estate investing, not from passive coupon clipping in a brokerage account.
However, I believe there are intermittent opportunities where REIT investing can make much sense and offers diversification to the more traditional, hands-on real estate investment methods.
Contents
Real Estate Investment Trust (REIT) Definition
While there are different types of REITs to invest in, I’ll be referring to publicly traded equity REITs on significant stock exchanges where information is readily available, unlike private REITS exempt from Securities and Exchange Commission (SEC) reporting requirements. I am also excluding mortgage REITs (mREITS) in the context of this article, whose revenue derives from earning interest on loans.
When you invest in an equity REIT, you invest in a real estate company that owns and operates a portfolio of apartment buildings or other assets (office, industrial, retail) that pay investors in dividend income. REIT dividends come from recurring operating cash flow, refinances, and selling assets within the investment portfolio.
REIT Investing Benefits
Investing in REITs offers investors many advantages compared to private investment.
Annual Returns (Track Record)
Per NAREIT, I downloaded "Annual Returns for the FTSE Nareit US Real Estate Index Series."
I focused on FTSE Nareit All Equity REITs over a 52-year time horizon (from 1972 - 2023)
I looked at the total return (%), which includes dividend reinvestment (I’ll talk about automating dividend reinvestment next)
From 1972 through 2023, all equity REITs have returned 11.11%*.
This return includes a massive correction in 2022 when the REIT index lost 25% of its value.
It does appear that the public REIT markets were much faster to react to the rising rate environment than private real estate investment markets. I'm still seeing instances of pricing not reflecting the current investment landscape in 2024.
I know 11.11% pales compared to private investment packages that regularly tout 15%-20% IRR projections. However, many private assumptions depend on the residual sale, are far from realistic, and haven’t panned out over the past few years.
11.11% is solidified by 50+ years of history. If you've ever lost significant funds in syndication investments, you'd see a double-digit annual return as attractive and realistic.
*I ran an RRI formula in the Excel file setting the nper = 52, pv = 100, and fv = 23,923.60 (2023 index total for FTSE Nareit ALL Equity REITs)
Dividend Reinvestment Plan
If you invest in REITs, the regularly recurring dividends are likely the most significant attractor. Typically, dividends will hit your brokerage account quarterly.
Setting up a dividend reinvestment plan (DRIP) is a must. A DRIP allows you to reinvest your dividends in the same stock immediately upon receiving them.
For example, if you own shares in ABC REIT and receive a $1,000 dividend, that $1,000 immediately buys more ABC REIT shares.
If ABC REIT stock trades at $100, your brokerage will purchase ten more shares.
Most brokerages also allow fractional share purchases. For example, if ABC stock pays you a $50 dividend and trades at $100, your brokerage would purchase you 0.50 shares.
Converting a cash dividend to shares has a massive compounding benefit. You're converting a dividend into shares that will produce more dividends forever. The cycle continues in perpetuity.
In a private real estate investment, you can't return your distributions to the underlying project like you can with REIT dividends. And if you want to invest your private real estate distributions, it won't be automated, which can impact the compounding of your overall wealth.
Information & Transparency
In private syndication, the sponsor generally files a 'Regulation D’ exemption to sell its securities while forgoing the requirement of registering its investment offering with the SEC.
While a good sponsor regularly sends updates and financial statements to their LP investors, their record keeping will not be as thorough and rigorous as that of a publicly traded REIT complying with the SEC reporting standards.
Information is abundant in the publicly traded REIT world. Public REIT companies are held to the highest reporting standards, and the SEC requires quarterly and annual filings. I can do deep dives into REIT companies to find information relevant to my investment thesis, such as:
Investment expertise (asset class, asset quality, business plan such as value-add, redevelopment, or development)
Acquisition Targets
Geographies (markets they invest)
Dividend history and future dividend outlook
Debt Load
Quantity of Debt
Fixed/Floating
*Debt Maturity Schedule*
Debt as % of Market Cap
Operations Data (occupancy, rent growth, expense inflation, NOI Margin)
Capital expenditures (CAPEX) and future CAPEX needs
*With rising interest rates, the debt maturity schedule is critical. Ideally, you’d avoid companies with heavy debt loads with significant loans rolling off their book in 2023/2024 and perhaps 2025.
Compared to private real estate investments, you’ll have heaps of data on the real estate business and information about the properties within the REIT.
Liquidity
When you put your money into private syndication, it's generally locked in, and you are at the whim of the sponsor. A medium/long-term timeframe is a good thing, and a responsible sponsor deserves an opportunity to execute their business plan with funds from investors without the fear that the cash could be pulled at any minute.
Illiquidity can be frustrating when the business plan begins to sour. As an LP investor with little influence, your money is locked in even if the direction of the investment is troublesome. It can feel like a slow-moving train wreck.
While REITs also have the potential to underperform from projections, the liquidity of the publically traded REIT market allows you to make changes if management isn't executing to your standard. This flexibility would be greatly appreciated by many passive LPs in early 2024.
Back on the transparency note, you can follow along with the quarterly reports, conference calls, and presentations and make real-time decisions if your investment funds could be better allocated elsewhere.
Minimum Investment
Most private real estate investments require a minimum investment, often as much as $50,000 or $100,000. If you’re buying real estate alone (without investors), you must make a sizeable downpayment, pay miscellaneous fees, and potentially fund a reserve. Allocating 25%-35% of the purchase price is not unreasonable in a low-leverage environment.
With public REITs, there is no minimum investment requirement. You can ramp up your investments as your budget allows. No minimums are helpful for beginners who may not have accumulated nest eggs to dip their toes into private investing.
Diversification
When you invest in a REIT, you get exposure to multiple properties. These could be thousands, if not tens of thousands, of units, potentially in different geographies and spanning various asset classes.
If you were to invest $50,000 in a REIT, that $50,000 would be spread over dozens, if not hundreds, of properties. If you wanted more diversification, you could invest $25,000 in two different REITs that cover different geographies. Or you could invest $5,000 in ten different REITs.
Many private real estate investments require a minimum of $ 50,000. If you have a multi-million dollar net worth, you could spread multiple $50,000 investments over various real estate properties with different sponsors and business plans, creating more diversity. However, putting most of your eggs in one real estate deal is risky, even if you're a seasoned investor.
It may take decades of working to accumulate enough capital to spread over various investments/sponsors to get proper diversification in your private real estate investment portfolio. With REITs, you can begin investing immediately at any net worth level and have adequate diversification from day one.
Share Buybacks
Sometimes, REITs pause acquiring real estate assets and purchase back their stock in the open market if they feel the stock is undervalued, which benefits the other shareholders with appreciation.
You can check quarterly reports of publicly-traded REITs regarding their stock purchasing activity. The firms purchasing back stock in large quantities are likely doing so because they feel their assets are undervalued, or their for-sale inventory is overvalued (probably some combination of the two).
A combination of NAV/Share > Stock Price (more on this later) and a firm ramping up stock buybacks are two solid indicators that the REIT is undervalued, and owning REIT shares could be a fruitful investment endeavor.
REIT Investing Drawbacks
Liquidity
While the liquidity of owning REIT shares is a strength, it could also be perceived as a weakness. The illiquid nature of physical real estate investments makes it easier to hold in bear and bull markets, creating the most compounding and long-term capital appreciation in the long run. REIT shares repricing every second could cause you anxiety and to act irrationally.
Volatility
On that same note, the REIT share price can be volatile. Sometimes, this volatility is justified, but other times, it may be overblown. In times of market turmoil, there may be an opportunity to maximize value in REITs, which I’ll touch on shortly.
Taxes
American tax law is complex with REIT shares, and it’s best to discuss the implications with your tax advisor. REIT dividends are commonly taxed as ordinary taxable income as they are generally non-qualified distributions.
I thought this article summarized some of the nuances of REIT investing nicely.
Private investment can also offer depreciation, bonus deprecation if the sponsor gets a cost segregation study, and potential capital gains tax deferral via a 1031 exchange. However, the depreciation deductions are best utilized by qualified real estate professionals (REPS) who can use passive losses against their active income.
Disclaimer: Always consult a tax professional before committing to an investment strategy.
Fees/Costs
In a private real estate investment, you are invested in real estate and the people and processes that manage the asset. In a REIT, you are invested in a company with hundreds if not thousands of employees, office buildings, and other overhead. You’re not invested in only the real estate property but in a more costly business that could indirectly affect dividend yields.
Residential REIT Performance
May 2022
We’re at a unique juncture where the stock market is declining. A hawkish Fed insistent on curbing inflation via interest rate increases and quantitative tightening has caused unease in the equity markets, including REIT stocks. Today, a handful of the most prominent residential REITs are down around 20% from their all-time high valuations.
Interestingly, this correction has not been felt in the private markets (at least not yet). Per NaReit, the go-to informational resource for REIT investment, private real estate markets tends to lag public REIT markets.
This phenomenon is tied directly to liquidity. REIT shares can trade at fractions of a second on new information becoming public. Private real estate will take months to list, receive buyer feedback, and close. There is a massive time lag between fundamentals today and future trends in the private markets.
February 2024
Checking back in with some of these stocks nearly two years later, all have fallen further.
2022 continued to be a brutal year for REIT stocks. While 2023 REITs saw a recovery at the end of the year and an overall positive (albeit modest) year of growth, 2024 is off to a shaky start.
REIT Analysis: NAV vs. Market Cap
As investors, we must ask ourselves, “Are equity markets overreacting?” If so, there may be an opportunity to scoop up REIT shares in correction territory and undervalue the real estate within the portfolio.
Net Asset Value (NAV)
NAV is a common acronym thrown around REIT circles.
NAV = All Real Assets - All Liabilities
Real Assets are mostly the real estate properties that constitute the REIT, and liabilities are typically the property mortgages.
As an example, if a REIT holds $6.0 billion of self-storage properties and $3.6 billion of debt on the portfolio, the NAV is calculated as follows:
NAV = $6.0 - $3.6 = $2.4 billion
In other words, all assets in the REIT are worth $2.4 billion net of debt.
Market Cap
If this same self-storage REIT was publicly traded, you could find the market cap.
Market Cap = Total Stock Shares Outstanding x Stock Price
If 25 million shares are outstanding and the current stock price is $90, the Market Cap is calculated as follows:
Market Cap = 25 Million Shares x $90 = $2.25 billion
Most financial sites will provide you with the market cap (they do the calculation for you).
Comparing REIT NAV to Market Cap
If we divide the NAV by the number of outstanding shares, we can intuitively compare the NAV to the share price.
$2.4 billion / 25 million shares = $96 / share
NAV/Share = $96
Stock Price = $90
At first glance, the stock may be undervalued, as it trades at a discount to NAV. In other words, the company's assets are worth more than its current market cap. There are infinite reasons why the “NAV” and “Market Caps” differ, and they rarely align.
The NAV is nearly impossible to depict accurately on time. If a REIT owns 500 apartment properties of varying asset classes in different states and cities around the U.S., it would need to depend on sales comps, appraisals, or a broker's opinion of value as a benchmark valuation for each property. Even with top-tier professionals evaluating the properties, the “asset pricing” is still theoretical unless an actual arms-length transaction exists.
This exercise would be a massive undertaking, and even if it was completed, the sales data is constantly changing, and market cap rates are likely to change. NAV is a fleeting metric even when used on relatively stable physical assets.
In my experience, NAVs for REITs are not easy to find. Most REITs do not publish this data. However, the equity firms researching the REITs will often take a stab at it, and you can find some of that research online by searching:
“REIT ABC + NAV Analysis”
NAV Potential
There is potential to purchase REITs as a suitable real estate investment strategy when the NAV of the real estate portfolio dramatically exceeds the market cap of the stock (the stock is underpriced).
NAV > Market Cap = Opportunity
I plan to show you how I would interpret this information. You need to find the NAV data (as current as possible) published by a third-party research firm or directly from the REIT itself.
I found that the REIT Nexpoint Residential Trust publishes NAV data quarterly via an 8-K:
May 2022
Company: NexPoint Residential Trust
Ticker: NXRT
Price: $74.60
Market Cap: $1.92 billion
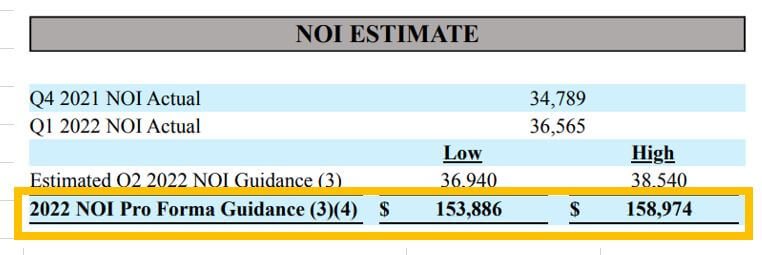
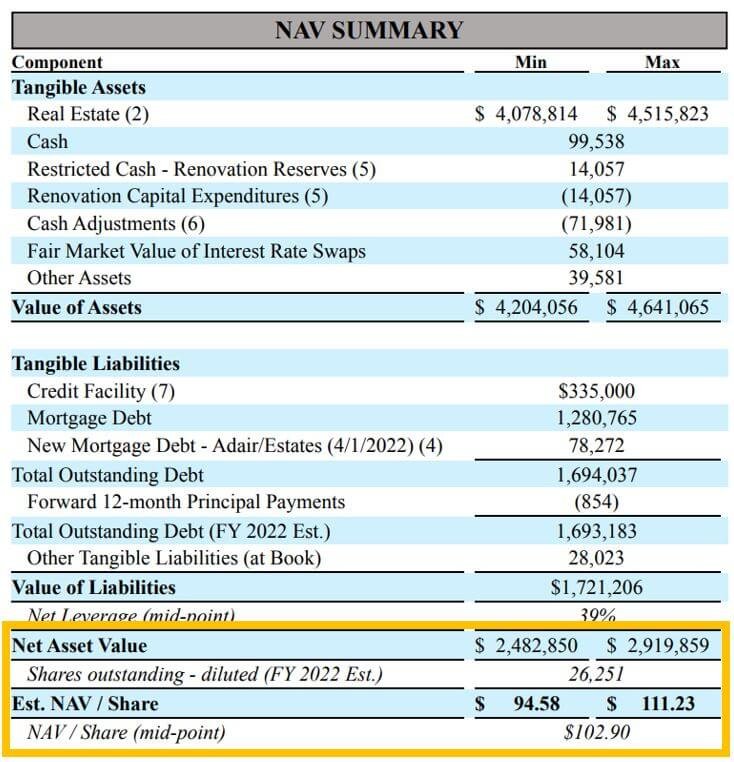
Below, I included a screenshot from NexPoint Residential Trust’s 8-K report.
I interpret this information as the following:
They have an annual “NOI Estimate in the bottom left-hand corner.” 2022 Q1 NOI is final, and then they make projections on how they expect the year to finish and a reasonable NOI range of $154M to $159M.
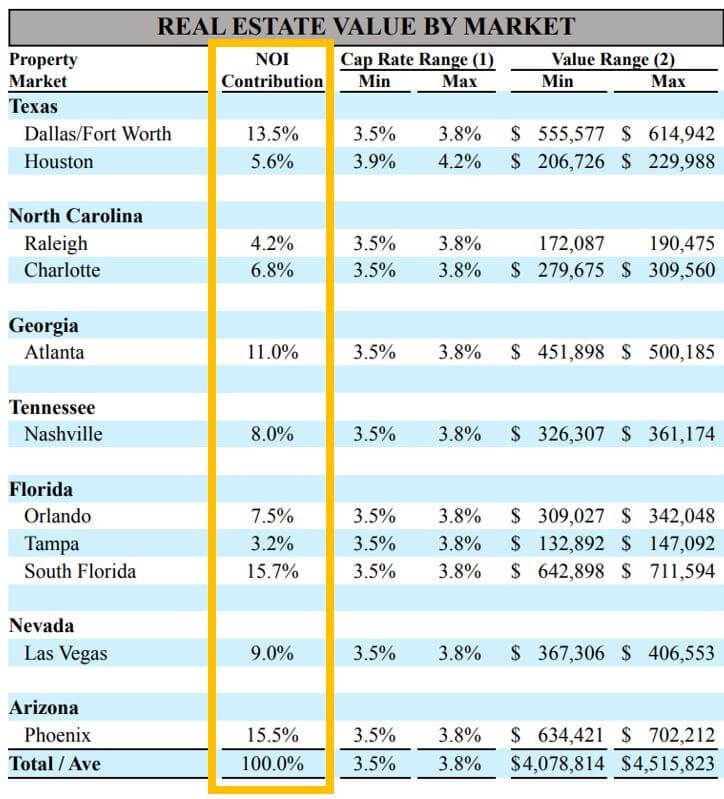
Let’s jump to the “Real Estate Value By Market” section. Here, they allocate the 2022 NOI estimate over the various markets they’re invested in.
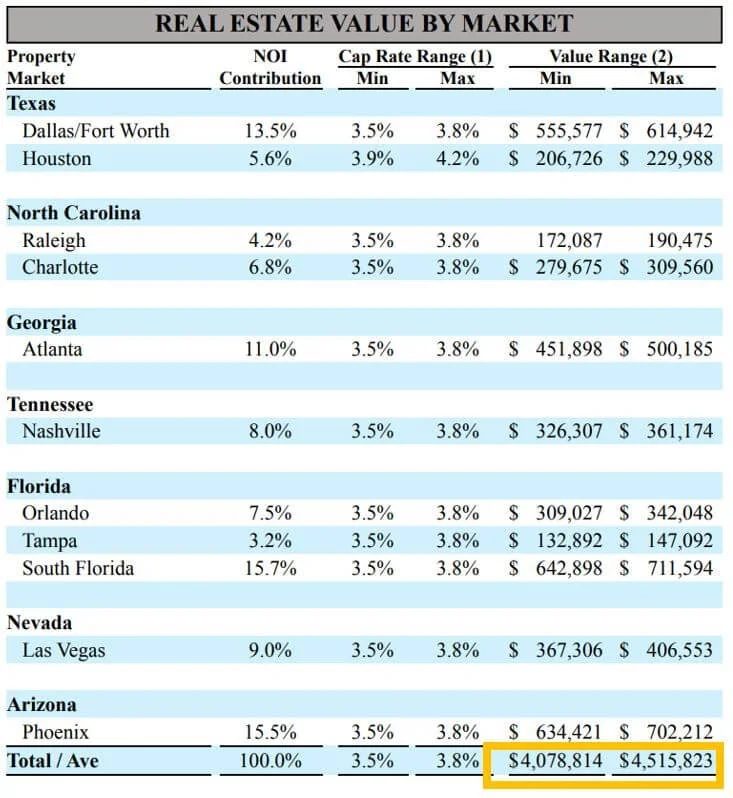
They apply a cap rate range (low and high) to each submarket to determine asset valuation by location. All ranges are 3.5% - 3.8%, except for Houston, which is 3.9% - 4.2%. The total valuation range of all assets is $4.078 billion to $4.516 billion.
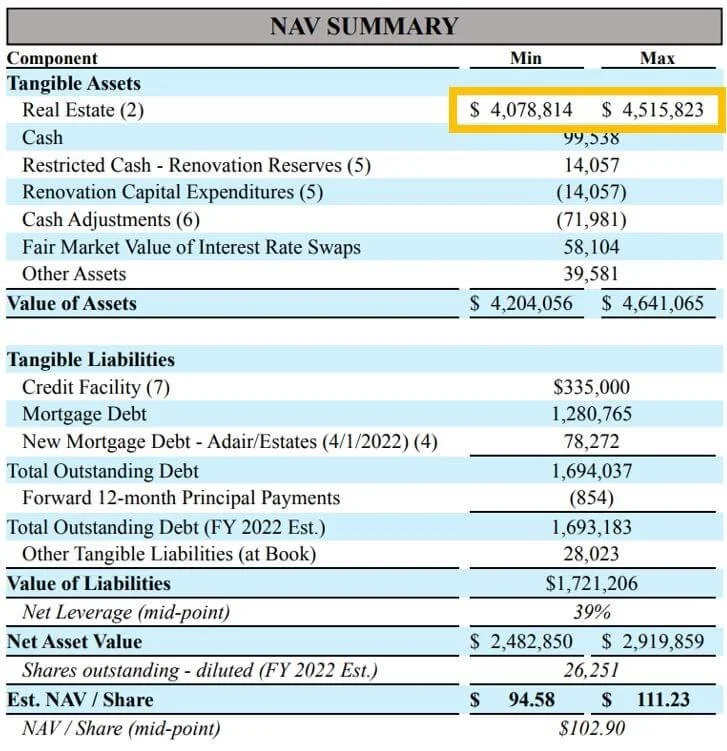
The “NAV Summary” section starts where we just left off.
They first make adjustments that slightly increase the total value of assets. They then subtract out all of the liabilities (mostly debt).
The Net Asset Value = $2,482,850 to $2,919,859
When applying that to the shares, NAV/Share = $94.58 - $111.23
The NAV/Share Midpoint = $102.90
NAV = $102.90
Stock Price = $74.60
NAV > Stock Price by nearly 38%
Could there be an opportunity to purchase an incredibly undervalued stock? To the tune of 38%?
Perhaps, but 3.5% - 3.8% cap rate valuation ranges are very aggressive. With interest rates rising, I question if these cap rates are sustainable long-term. Prudent REIT investors may feel the same way, so the stock price trails the NAV/share considerably.
NAV Model Adjustments
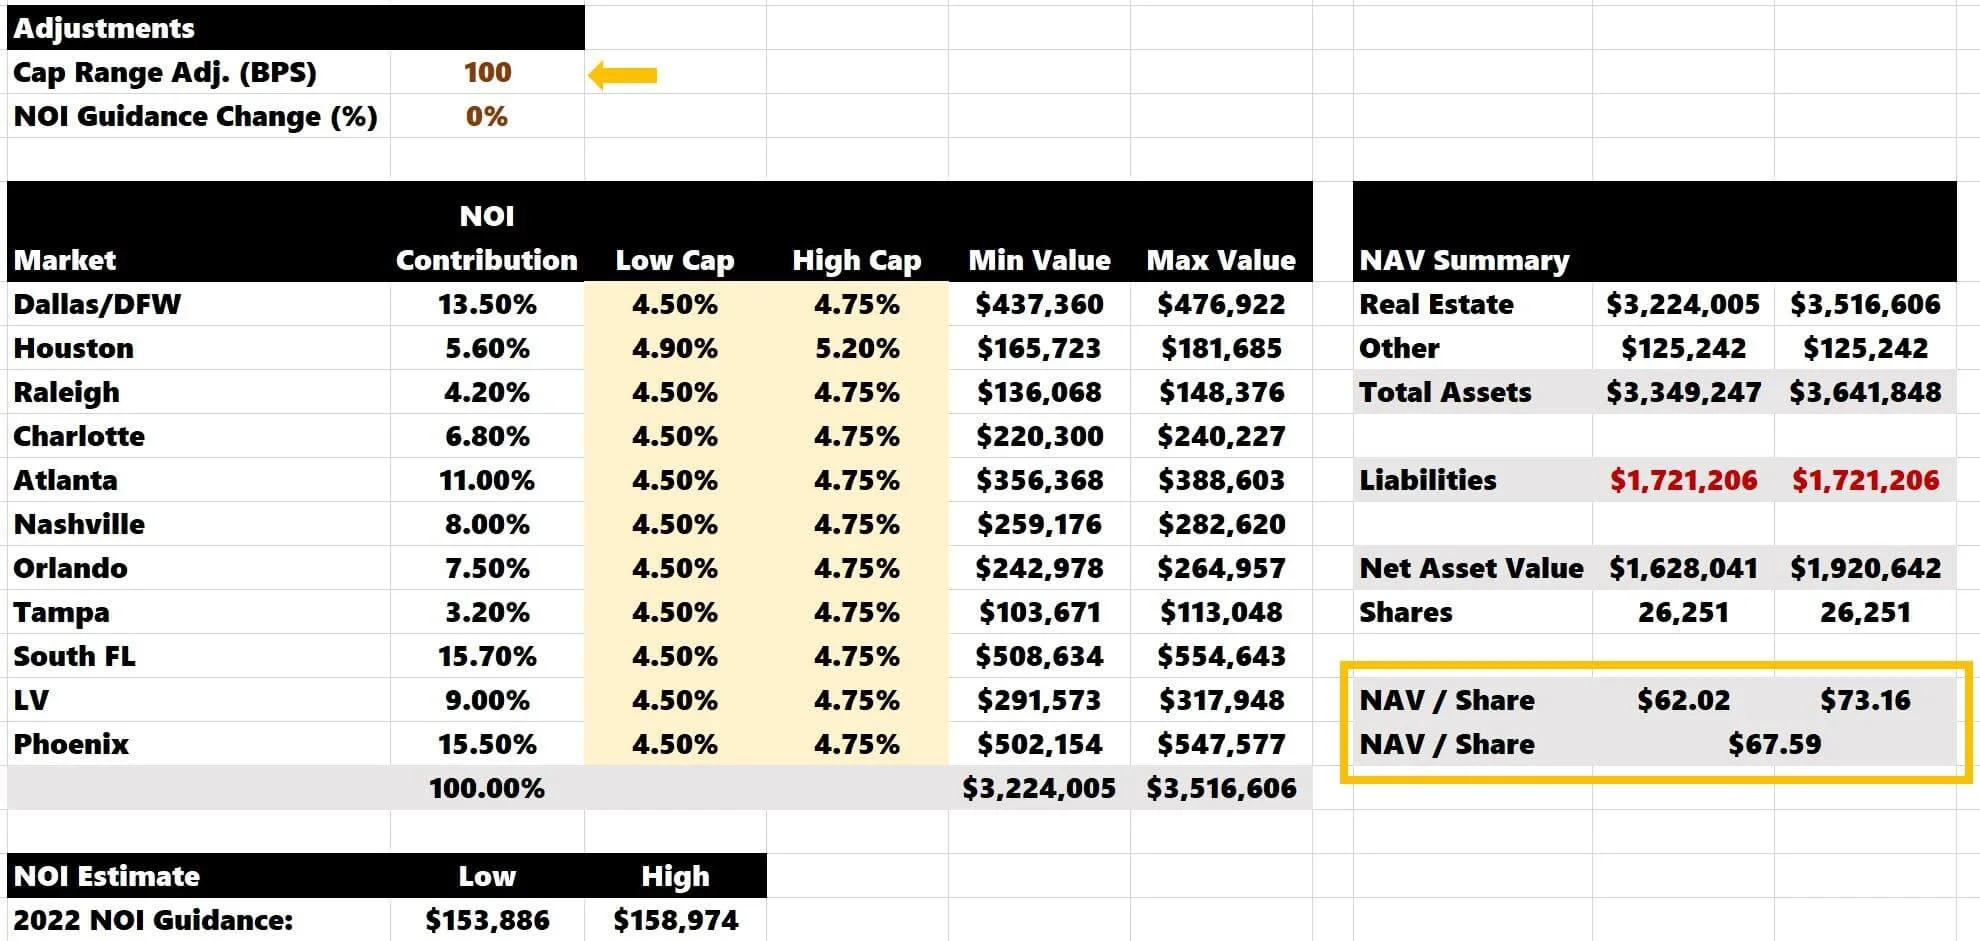
The NAV image above is an easy model to recreate to tweak some assumptions. I am going to build it in Excel to allow me to do two things:
Adjust cap rate ranges
Adjust NOI range
Therefore, I can shock both of these inputs and compare them to the current stock price of $74.60
The numbers aren’t identical due to a rounding error. I’m using a 3.75% cap as the “high” cap rate, which seems more accurate than the 3.80% referenced in the 8-K document.
However, it’s close enough to be dangerous. Now, I want to add 100 bps to the cap rate ranges.
With this change, the NAV range falls to $62.02 - $73.16.
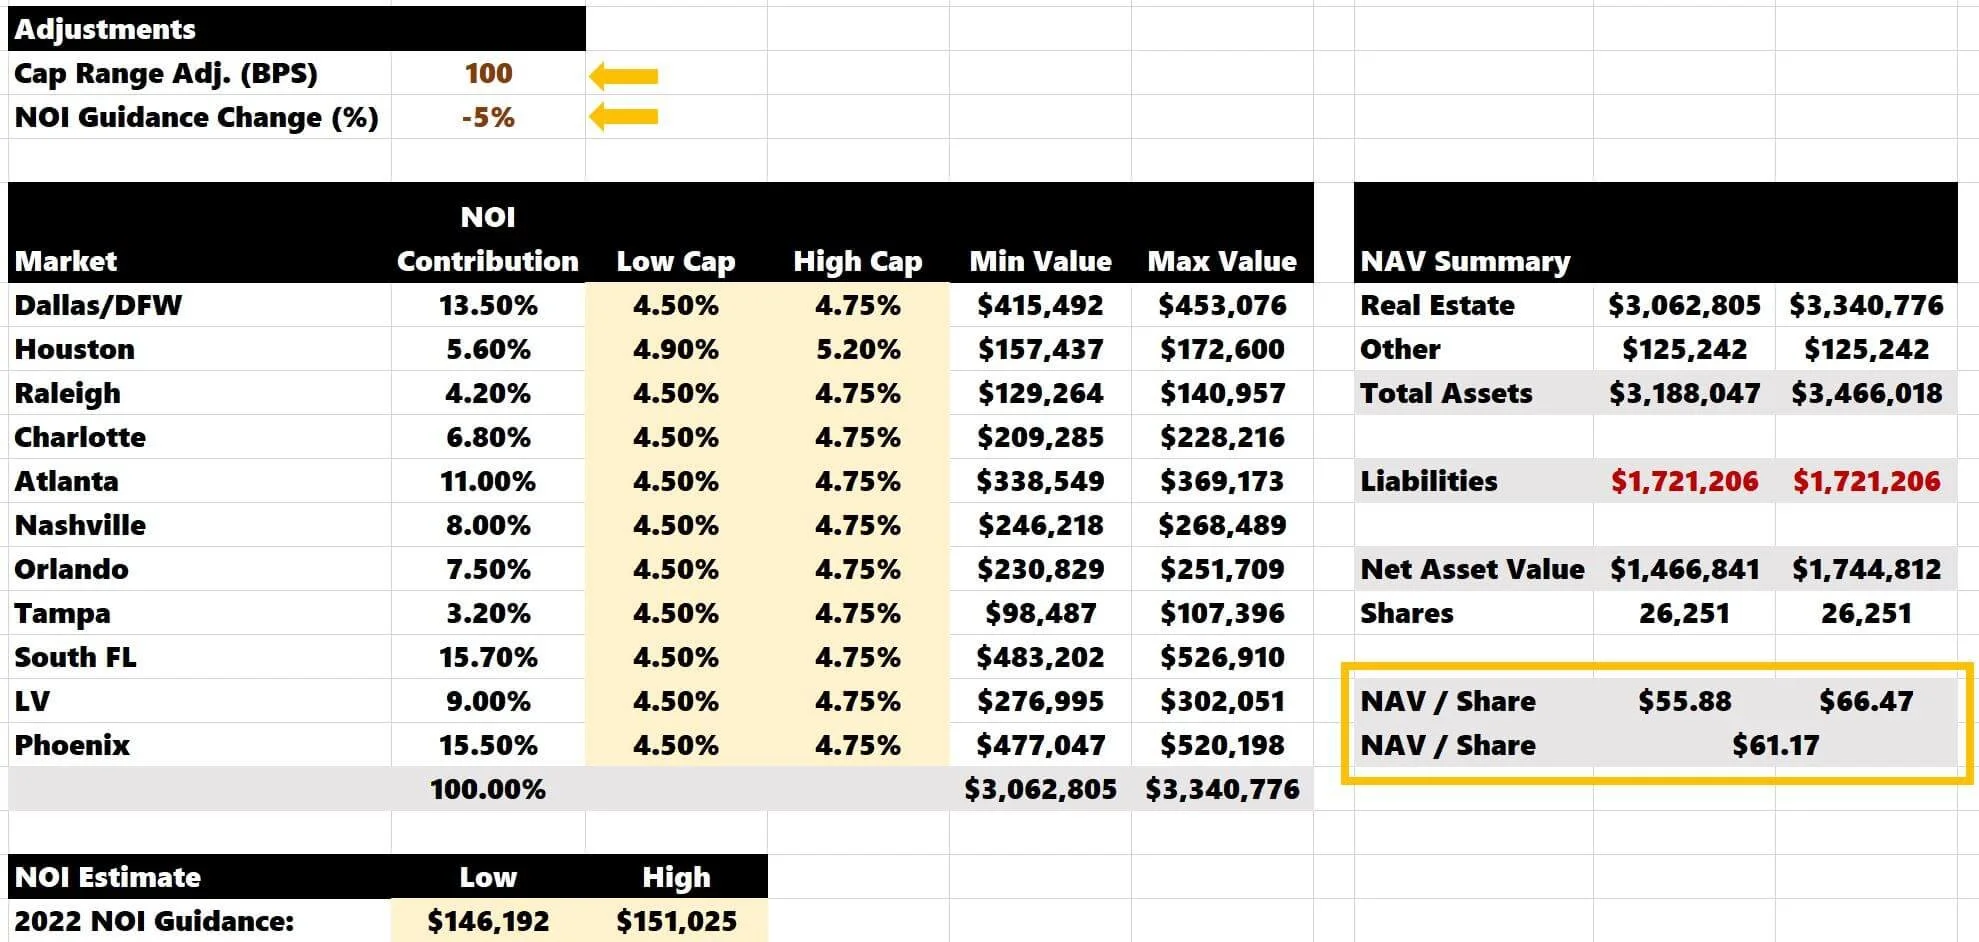
I also want to stress the NOI, say -5%.
Now, the NAV range decreases to $55.88 - $66.47.
The mid-point NAV of $61.17 falls short of the current stock price of $75. In other words, if you are bearish on the multifamily outlook and expect the cap rate to expand in the new macro environment and NOIs to drop slightly, $75 per share isn’t a screaming deal.
On the flip side, if you think cap rates will hold steady or compress further and the NOI will continue to increase beyond expectations due to rent growth, there would be potential to own this REIT at an attractive price point.
You could run multiple compression/expansion scenarios for cap rate ranges and NOIs and compare the NAV/share to the stock price.
February 2024
The latest NXRT 8K document is from 10/31/2023. NXRT made significant revisions to its market cap rates. Now, all markets are 5.5% - 6.0%.
The NAV/Share midpoint is $54.45, down 47% since the last time we ran this analysis in 2022. The current stock details are:
Ticker: NXRT
Price: $29.92
Market Cap: $767.77 million
NAV > Stock Price
$54.45 > $29.92
(stock is 44% under the value of the latest NAV estimate)
I would be confident in saying there is definitely a possibility for this stock to be undervalued. However, NXRT has a significant amount of floating-rate debt and rate caps, and you’d need to understand the future interest expense exposure as rate caps roll off; ultimately, this could be a factor in why the stock and NAV are so far apart.
While I was correct in 2022 that the cap rate projections/valuations were too aggressive in a rising rate environment, I would have never dreamed that in less than two years, 3-handle cap rates would be revised upwards to 6-handles.
Disclaimer: I am using NXRT for the sake of an example. To determine its investment feasibility, I would do a deep dive into researching each market they've invested in and justify future cap rates from expert broker commentary, sales comps, and labor statistics trends. THIS IS NOT INVESTMENT ADVICE.
State of Private Real Estate Investment
2022
One thing that jumps out is that the private real estate market is likely overpriced. We can see that current REIT pricing factors in a modest correction in real estate values. Until this sentiment shakes through to the private markets, I wouldn’t feel comfortable purchasing assets at record pricing.
This information is helpful for private real estate investors. It acts as a market pulse of sorts and is good intel. I would be hesitant to invest in a property where I’d pay a 3.5% cap rate range for an asset. If the REIT investors aren’t willing to give credit for valuations at a 3.5% cap, why would I, as a private investor?
2024
I’m finally hearing about discounts creeping into the private real estate market. Surprisingly, despite the market's softness and a challenging macroeconomic environment, I’m still seeing a fair share of aggressively priced projects.
I’ve read press releases about projects purchased in the Sunbelt at 3%-4% cap rates in 2020-2021 facing foreclosure, and there is a lot of uncertainty about projects with financing set to balloon in 2024/2025.
I think valuations will continue to deteriorate overall in the U.S. in 2024, but more so in markets that saw a massive bull run in 2020-2021 and have been seeing record-setting deliveries of new apartment supply this year.
Interesting: See how REITs performed in the 1970s during a period of stagflation.
Summarizing Public REITs vs. Private Real Estate
Public REITs can be a prudent investment choice and offer diversification to the more traditional, hands-on real estate investment methods for individual investors. Researching a REIT’s holdings, track record, business plan, and overall strategy and comparing the share price to the NAV/share could offer a solid perspective into a great investment opportunity.
Even if you never purchase REIT shares, the information you uncover while researching them can also help you assess the private real estate outlook.
Disclaimer: This article is only meant to provoke thought. This is not investment advice. Always consult with an investment professional before making any financial decisions.


