Real Estate Investing with Rising Interest Rates
Article Updated: 5/15/2024
The U.S. Federal Reserve made its intentions clear in late 2021 with rate hikes and reducing its balance sheet to curb the high inflation stemming from unprecedented pandemic stimulus measures and dovish fed policy.
Many investors may feel vulnerable to future interest rate hikes and question their medium-term investment strategy as treasury rates rise.
I have seen trepidation from the macro pundits and economists about future economic growth forecasts. Doom and gloom may catch more headlines, but there are still positives that investors would be wise not to overlook.
This article will examine how specific economic trends paramount in CRE investment fundamentals have fared during the 2022-2024 rate hike cycle.
Trends Affecting Real Estate
Fed Funds Rate Hikes
To date (May 2024), the Fed has raised rates 11 times since March 2022. The current Fed Funds rate is 5.25%—5.50%. At writing, the consensus leans towards rate cuts towards the end of this year, although inflation has remained well above the Fed mandate of 2%, and the employment market is incredibly resilient.

Source: fred.stlouisfed.org
U.S. Economic Primer
While the central bank’s decision to raise the federal funds rate is to curb inflation, it’s also a testament to the current health of the overall economy that no longer requires the drastic policies enacted during the pandemic.
I’d argue that fed policy from 2020 to 2021 was overly accommodative to the extent that inflation was unavoidable, at least in the short term (hindsight 20/20, I suppose). I don’t think anyone of authority involved in the monetary policy enacted since 2020 is surprised by the inflation readings at 9% year-over-year at their peak.
In Jerome Powell’s opinion, perhaps a lackluster economy on shaky footing was riskier than a few months of eye-popping inflation. With the economy performing well across various metrics, the hawkish monetary policy shift could be perceived as a mission well-accomplished.
Here are some labor statistics to keep an eye on each month:
Unemployment
2022 Unemployment Outlook
The Bureau of Labor Statistics (BLS) recorded an unemployment rate of 3.6% in March 2022 (1). In February 2020, before Covid-19 gripped the economy, unemployment was 3.5%.
2023 Unemployment Outlook
As of March 2023, the unemployment rate is 3.5%, still near all-time lows, even with the aggressive Fed rate hikes (1). While tech layoffs tend to grab the headlines, recent job loss is dwarfed by the number of jobs added in 2020-2021.
The unemployment rate doesn’t tell the whole story, but it is promising to see it back near historical norms despite the aggressive Fed policy.
2024 Unemployment Outlook
As of April 2024, the unemployment rate is 3.9% (1). While this is higher than it has been for most of 2022 and 2023, it is still near all-time lows from a historical standpoint.

Source: fred.stlouisfed.org
(1) https://www.bls.gov/bls/news-release/empsit.htm
Job Growth
2022 Employment Outlook
BLS reported an increase of 431,000 for non-farm payroll in March 2022. Employment has still been down 1.6 million since February 2020.
2023 Employment Outlook
Over the last six months, job creation has consistently exceeded consensus estimates, in some cases substantially (see January).

March was another strong month of job growth. Eight out of twelve months (75%) exceeded expectations, with January, May, and September smashing expectations.
2024 Employment Outlook
2024 was off to another good start, with January jobs nearly double initial estimates and two beats in February and March.

April came in below expectations by 63,000 jobs, the largest miss in the past 16 months.
Labor Force Participation
2022 Labor Participation Outlook
BLS reported March 2022 participation at 62.4% (1). Still, one percentage point below February of 2020 (63.4%) is a big reason job recovery is not entirely caught up (people have left the labor force and are no longer tracking as “unemployed”).
2023 Labor Participation Outlook
While March 2023 participation was slightly above March 2022, marking 62.6% (1), it remained well below pre-COVID readings.
2024 Labor Participation Outlook
Labor participation has held relatively steady since 2023 and currently sits at 62.7% (1) as of April 2024. The image below is not seasonally adjusted.

(1) https://www.bls.gov/bls/news-release/empsit.htm
Personal Savings Rate
From a personal finance perspective, the individual savings rate in 2020 - 2021 spiked multiple times during the pandemic and corresponding lockdowns. Peak savings were an astonishing 33.8% in April 2020, followed by another spike of 26.6% in March 2021, per the St. Louis Fed (2).
2022 Personal Savings
While personal savings as a percentage of income stabilized in 2022, households undoubtedly have elevated liquidity. A February 2022 Washington Post article estimates $2.6 trillion in additional savings.
2023 Personal Savings
Reviewing the recent FRED data, the personal savings rate in February 2023 was at 4.6% (2), slightly higher than the March 2022 reading of 3.7% but nowhere near the savings blips we saw in 2020-2021.
2024 Personal Savings
Per FRED data, personal saving is down to 3.2% as of March 2024 (2).

Source: fred.stlouisfed.org
Also of note, during the five years from January 2014 to December 2019, leading up to the pandemic, the personal savings rate was consistently above 6.3% and reached as high as 9.4%.
(2) https://fred.stlouisfed.org/series/PSAVERT
Mortgage Delinquencies
Anytime the housing market faces any headwinds, the 2008 comparisons are soon to follow. The 2008 housing bubble was fraught with fraud and deceit. The prevalent mortgage of the era, the adjustable-rate mortgage (ARM), ballooning and requiring repayment when the market began to turn, was ultimately the kiss of death.
2022 Delinquencies
The most significant consequence of the housing meltdown was more stringent residential lending requirements.
In this cycle, fixed-rate mortgages are the norm, most with lower interest rates than historical norms. Per the St. Louis Fed, mortgage default rates in Q4 of 2021 were 2.27% (3), a very healthy percentage when looking back at decades of default data.
2023 Delinquencies
Delinquency rates have been on the decline since late 2021. According to FRED data, in Q4 2022, the mortgage delinquency rate was 1.77% (3).
2024 Delinquencies
Single-family home mortgage delinquency has continued to drop over the course of the year, and as of Q4 2023, it is recorded at 1.69% (3).
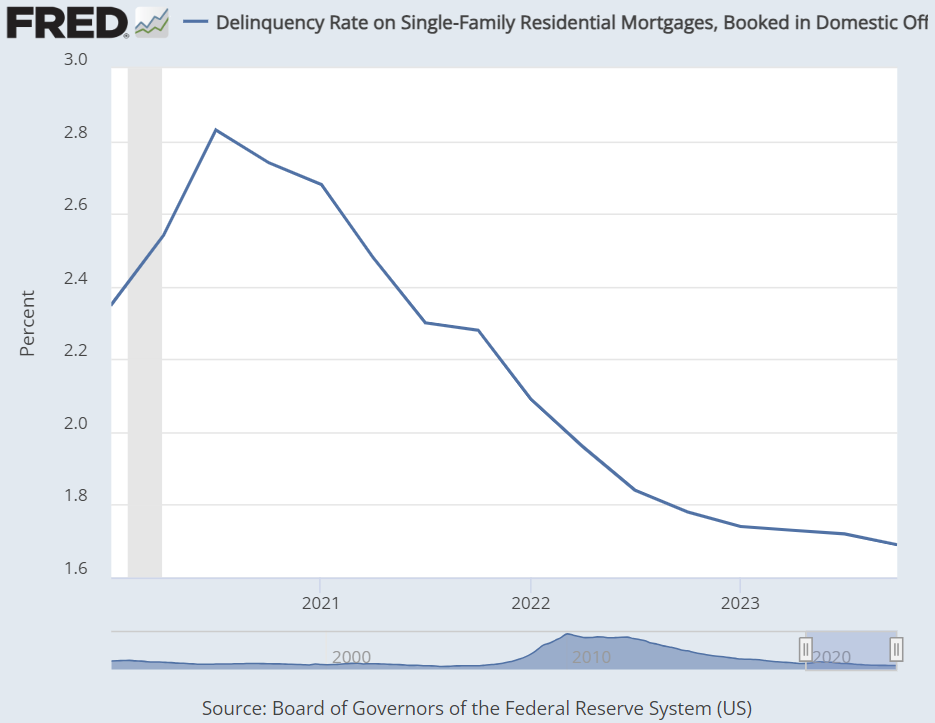
Source: fred.stlouisfed.org
(3) https://fred.stlouisfed.org/series/DRSFRMACBS
Fiscal Policies
The president can enact fiscal policy measures to help combat the Fed funds rate increases and quantitative tightening. There’s a crucial one I’ve been keeping my eye on: Student Loans
2022 Student Loan Outlook
The Biden administration extended the student loan moratorium through August 2022. As of Q4 2021, student loan debt was the largest allocation of non-housing debt at $1.73 trillion, per the St. Louis Fed.
Other policies involving taxation and government spending could help combat consumer unease as we peel back the last two years of friendly monetary policy.
2023 Student Loan Outlook
The Biden administration extended the student loan forbearance until August 2023, and it appears unlikely that up to $20,000 in Federal student loans will be forgiven for qualified borrowers—student loan debt eclipsed $1.76 trillion outstanding as of Q4 2022.
According to educationdata.org, as of December 2022, 63.6% of all federal student loans remain in forbearance. Without a new extension, this could massively impact people’s ability to pay rent, mortgage, and other consumer spending habits.
2024 Student Loan Outlook
Per educationdata.org, the average student loan payment as of May 2023 is $503. While the Biden Administration is still proposing a policy to cancel student loans for millions of borrowers, assuming the courts continue to strike down Biden’s plans, student loans will continue to eat into a serious portion of American discretionary income.
Interest & Cap Rate Correlation
There’s much discussion on whether interest and cap rates are positively correlated. I believe that a positive correlation may be more prevalent at the extremes, but generally, correlation does not imply causation.
Extreme Example: A leveraged buyer aggressively bids and wins a deal at a 3.5% cap rate. The sale sets a pricing record. They can get financing with a 3% interest rate. If the market debt is priced at 6% a year later, the same leveraged buyer will have to bid less aggressively to meet various debt covenants like DSCR.
When interest rates rose, so did cap rates, which led to a positive correlation. I call this scenario “extreme” because this aggressive pricing set a high-water mark for pricing and wasn’t the norm when looking at all sales that have occurred.
Negative Correlation
In theory, interest rates and cap rates should be negatively correlated. The underlying economic fundamentals should be healthy in a rising interest rate environment. Strong fundamentals bode well for investors dependent on gainfully employed tenants who are paid well to make good on their monthly rent obligation.
On the flip side, fundamentals are weak in a decreasing rate environment and should cause property owners to be concerned about future economic prospects. We saw this firsthand in the multifamily investment space in the spring of 2020. Uncertainty about the pandemic caused the deal volume to plummet.
Spikes in rent delinquency and uncertainty put our industry on hold. The Fed almost immediately implemented holding its benchmark interest rate near 0% to help quell the unease across all sectors.
2024 Multifamily Pricing Update
Rising rates clearly impacted multifamily asset pricing around the county. In many markets, brokers have been adamant that pricing has corrected by 15% to 30% from the 2021/2022 “all-time high-water” pricing.
It’s also evident in the publically traded REIT market that many high-profile multifamily REITs were trading from 30-45% below their “all-time high” market caps.
Excess Capital (Dry Powder)
2022 Capital Markets Outlook
There’s no shortage of capital chasing alternative investments like apartment complexes. I receive many limited partners (LP) capital raises via email; most are oversubscribed within days (sometimes hours).
2023 Capital Markets Outlook
The tides are shifting a bit in early 2023. I know that Syndicators who used to raise capital in a matter of days now send repeated emails to spark investor interest over weeks if not months. Some have switched to a 506c raise structure, which allows for comprehensive deal marketing (requiring investors to be accredited) and casts a wider net on potential investment audiences.
2024 Capital Markets Outlook
Anecdotally, LP capital is incredibly challenging to raise in the current environment. With the risk-free rate hovering around 5%, investors are yield-sensitive and much more sensitive to risk-to-return metrics.
Rent vs. Own
The classic “rent vs. own” debate has drastically skewed towards renting in many markets around the U.S. and Canada. Record low housing supply is outpaced by housing demand, making homeownership unrealistic for large swaths. Rate increases on most financing options haven’t been enough to deter the insatiable appetite for homes (at least not yet).
2022 Homeownership Outlook
Per Optimal Blue, the average 30-year mortgage rate is 5.05% (4). Just last year, a mortgage rate under 3% was commonplace. On a $400,000 home purchase with a 20% downpayment, a 5.00% mortgage rate compared to a 2.75% rate adds over $400 to the mortgagee's monthly principal and interest payments.
2023 Homeownership Outlook
Today, the mortgage rate is 6.33% (4). For the same $400,000 home purchase with a 20% downpayment, a 6.33% mortgage rate, compared to a 2.75% rate, adds nearly $700 in monthly principal and interest payments.
Higher interest rates affect mortgage payments, auto loans, student loans, and credit card rates. Mortgage brokers look at the entire debt picture to determine a potential homeowner’s income-to-debt ratio to qualify them for a housing loan.
Higher debt service and significant downpayment requirements could make renting more fiscally prudent. The pace at which rates rose has made many owners unwilling to give up their +/- 3% mortgage rate, exacerbating the already minuscule for-sale inventory and helping support lofty pricing. It’s still a seller’s market in many markets, even with 6%+ mortgage rates.
2024 Homeownership Outlook
Interest rates climbed to 7% as of May 2024 (4). With sluggish rent growth nationwide in 2023, continued housing appreciation, and sustained high borrowing costs, homeownership is 2x the cost of renting in many markets around the country.
(4) https://www2.optimalblue.com/obmmi/
Expense Inflation
In the current inflationary environment, the challenges of operating expense inflation are discussed less than the revenue side.
2022 Inflation Outlook
Utilities, payroll, contract services, turnover, and other costs related to repairs and maintenance (paint, lumber, metals) have increased substantially since the onset of the pandemic. As was commonplace pre-Covid, an annual inflationary escalator of 3% in proforma underwriting is insufficient for these expenses. I’ve talked to owners underwriting these expenses at monthly inflation readings or higher (8%+).
If rate hikes help curb inflation while supply chains catch up, apartment owners could benefit from operating cost cuts for these items. The threat of interest rate increases cooling off the housing market has likely helped lumber future pricing retreat 50% from one-year highs.
2023 Inflation Outlook
I’ve yet to hear of any significant relief from cost pressures. Quite frankly, it’s been quite the opposite. I surveyed Tactica email subscribers in Q4 2022, and 45% of respondents were concerned about expense inflation, the second most serious concern behind capital market deterioration. This trend and a cooling rental market could challenge ownership groups around the U.S.
2024 Inflation Outlook
If inflation stays elevated while GDP and employment substantially decline, stagflation is a real risk investors must consider.

Source: fred.stlouisfed.org
Summarizing Interest Rate’s Impact on CRE
Nobody can say with certainty what will unfold in the real estate investment sector if rates remain elevated for a prolonged period. The economic data has been relatively strong over the past two years since I began tracking economic performance, although not as robust lately as in earlier years.
Commercial real estate investment pricing has begun to correct in most markets. Still, residential real estate has continued to be buoyed by scarce listings, and owners locked into low-interest, long-term debt, and valuations have continued to increase.
My opinion (in 2024): If the Fed can nail the “soft landing” and begin tapering down the Fed Funds rate, I believe this will be a relatively shallow correction, where only investors with short-term financing from unagreeable lenders ballooning in 2023-2025 will feel the pinch.
If inflation continues to linger above the Fed’s mandate and its policy transitions to impact corporate America (and jobs), investors across the board (regardless of financing choices) will feel the impacts as the market reacts, and ultimately, valuations will continue to decline from current pricing levels. We won’t see a bottom in CRE corrections until more economic statistics deteriorate from current levels. The economy has been incredibly resilient to date.