Multifamily Development "Back of Napkin" Excel Template
I am excited to share the free Multifamily Development "Back of Napkin" Excel template. Please sign up below, check your email, open the document, and follow along. This blog post serves as a tutorial.
Download our Free Tactica RES™ Development “Back of Napkin” Template
A robust financial template that will allow you to vet a development site in 10 - 15 minutes. Enter your details below to get access.
Multifamily Development Feasibility Spreadsheet
I created a free property development feasibility spreadsheet that allows investors to vet a multifamily development site in minutes. This tool will tell you whether or not you should investigate a parcel further with a robust and detailed feasibility proforma analysis.
Development Feasibility Spreadsheet Contents
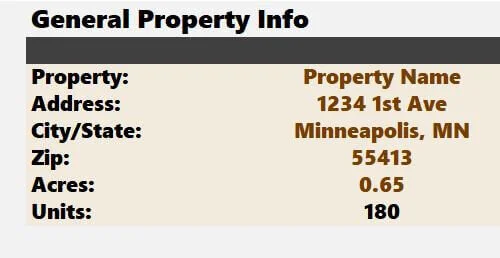
General Property Information
This section is where you’ll enter in:
Property Name (Proposed Name/Current Site Name)
Address
City/State
Zip Code
Development Site Acerage
The units populate automatically from the "Unit Mix" section.
Construction & Project Costs
This section is where you populate the development budget. For land, soft costs, hard costs, and "other," you have three different options for classifying each expense. You can go by:
Per SF
Per Unit
Chunk Price
Many developers know from experience the development cost on a per-square-foot basis (PSF). Some feel more comfortable estimating costs on a per-unit basis. Or, you can put in the gross costs (or chunk) and even use a mix of the three. You can see in the example below that I have $3,500,000 entered for land acquisition (or land contribution) and am estimating Soft/Hard costs on a PSF basis. Make sure that you only have one entry per row. Excel reads the entries from left to right and ignores anything to the right of the first entry.
The total development cost is summarized below. You can play with the different assumptions to ensure the all-in cost makes sense on a Per SF, Per Unit, and Chunk basis.
Apartment Unit Mix
In any apartment deal, the number of apartment units and the rent you can charge will be the most significant indicator of a successful project. I expect you are knowledgeable about the submarket and plugging in reasonable rent estimates. The only assumptions needed from you are:
Unit Type
Unit Count
Square Feet
Monthly Rent
The final assumption in this section relates to common areas. The total square footage of the residential units is "rentable square feet." There are also the hallways, a leasing office, a clubroom, a fitness center, a parking structure, etc. Typically, the rentable square feet (where residents live) run between 60% - 80% of the footprint of the entire project. You need to assume what percentage of the residential units' overall footprint. In this example, I am using 75%. Common area square footage then calculates automatically.
Multifamily Operations
The following section forecasts operating revenues and operating expenses. The first item needed is an economic vacancy assumption. Economic vacancy includes things like:
Unit Vacancy
Missed Rent Payments
Model Unit
Discounted Employee Units
I am using 6.25%. I assume the overall unit vacancy will be 5.00% and 1.25% in concessions and bad debt. Being conservative here is vital. If all the comparable properties in the submarket are giving away rental concessions, you should be factoring that into your vacancy percentage.
Now, we need to hammer out the ancillary line items. These are charges for things like:
Parking
Storage
Utility Reimbursements (RUBS)
Amenity Fees
Others (such as damages, application fees, move-in fees, lease-break fees, etc.)
For each line item, you need to specify the quantity of each item, its monthly charge, and the projected vacancy rate. The Excel spreadsheet will then calculate the net monthly, annual, and yearly amounts on a per-unit basis.
Note: For the "Other," there's no right way to quantify damages, application fees, or any other kind of fee. Typically, I focus on the "Per Unit" column and solve for what I have seen in past deals. I use the "Monthly Charge" column as the toggle to back into the per-unit that I think is reasonable. In this instance, that is $180 per unit (annually).
Finally, it would be best if you made an expense assumption. You can either do this by a percentage of revenue or on a per-unit basis. You must choose one or the other.
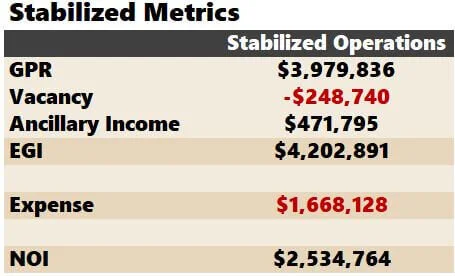
Stabilized NOI
Finally, you can review a summary of operations:
Gross Potential Rent (GPR)
Vacancy
Ancillary Income
Effective Gross Income (EGI)
Expense
Net Operating Income (NOI)
This section is simplistic and straight to the point. You'll notice no cash flow beyond NOI (no debt service or capital expenditures).
To reiterate, this analysis aims to give you a quick assessment of the financial feasibility of developing a particular parcel(s). It's more of a 10,000-foot view than a comprehensive investigation.
Investment Returns Potential
The final piece of the underwriting template requires two more inputs from you. You need to enter a loan-to-value (LTV) for the construction financing and a reasonable residual cap rate where this asset would likely sell.
In the image above, the essential return metrics are summarized.
Construction LTV
Entering an LTV percentage determines the construction loan amount and, more importantly, how much total equity you need to raise.
Equity Needed
This calculation is taking the Total Construction Costs * (1 - LTV) or $33,707,350 * (1 - 80%) = $6,741,470
Capitalization Rate at Sale
Be reasonable here. If you think the capitalization rate (cap rate) on a fully stabilized apartment building in the submarket is a 4.75% cap, add at least 50 basis points (bps) onto the residual cap rate.
Residual Value at Sale
The residual value at sale takes the stabilized NOI from the left and divides it by the residual cap rate from above.
$2,534,764 / 5.25% = $48,281,214
Equity at Sale
The equity at sale takes the residual value and subtracts the construction loan amount.
$48,281,214 - $26,965,880 = $26,965,880
Equity Multiple
The equity multiple takes the equity at the sale and divides it by the initial equity needed.
$26,965,880 / $6,741,480 = 3.16
Return on Investment (ROI)
Equity Multiple - 1 = 3.16 - 1 = 2.16
Presented as a percentage = 216%
Return on Cost (ROC)
ROC is the most critical metric. Developers compare the ROC to the projected stabilized cap rate. The spread between what they can build it for and what a potential buyer would pay is their profit potential. In this instance, a 2.27% spread is very healthy and would likely imply that the developer should do further analysis and potentially make an offer on the land.
7.52% - 5.25% = 2.27%
This is the best metric to determine if a development is financially feasible.
Video: Qualifying a Development Site
Excel Spreadsheet Limitations
What's nice about this template is that you can recycle it for every development site you vet. The tool's simplicity will allow you to reference multiple deals simultaneously and quickly compare projected costs, rent estimates, and profitability potential.
Related: Site visitors can download a “back of the envelope” multifamily analysis for existing properties.
I consider this tool to be a "narrow it down” instrument. If you use this template on five potential development sites, I hope this analysis uncovers which site you should investigate further. This Excel spreadsheet is meant to point you in the right direction.
After you pursue an opportunity, a much more thorough ground-up development analysis is required. An exhaustive exercise includes accounting for items such as:
Construction Loan Terms
Permanent Financing Terms (with the interest rate, amortization, and projected debt coverage ratio)
Itemized Construction Budget
Construction Draw Schedule
Lease-Up Summary/Schedule
Construct and Hold Analysis (this template doesn't factor in cash flow)
Detailed operating revenue and expense assumptions (broken down by line items)
Emphasis on Real Estate Taxes (specifically how property taxes increase post-stabilization)
IRR calculations for various holding periods
I offer a for-sale version if you need a tool encompassing all the facets from the bullets above. I built The Multifamily Development Model with feedback from active developers who were sick and tired of confusing, bulky, tedious legacy tools. The idea was to create something simple yet sophisticated that a user with limited Excel proficiency would still be comfortable with, producing a pro forma for any development site.
Summarizing the Development Feasibility Spreadsheet
I created a free template that allows investors to vet a development site in minutes. This tool tells you whether or not you should investigate a parcel further. It allows for a quick analysis of project components, such as backing into a reasonable bid on the land, rent targets, and return metrics.


