Multifamily (Apartment) Proforma Excel Template
This article is a tutorial that will teach you how to use our free multifamily analysis spreadsheet. I advise you to plug in your email below, download the template, open it up, and follow along in real-time. At the end of the tutorial, there is a video walking through underwriting for a sample apartment deal.
Download our Free Tactica RES® Multifamily Proforma Real Estate Template
This is a powerful deal analysis spreadsheet that will allow you to underwrite an apartment investment in 15-20 minutes. Enter your details below to access it.
Real Estate Proforma Spreadsheet Features
Property Summary
The first tab, labeled; “Summary,” is where you will input general property information as I did below.
General Property Info
You will be responsible for inputting information into all tabs that are the color brown.
Black text is labels or formulas, and you don’t need to edit it.
Closing Costs & Residual Assumptions
Escrow Fees and Closing Costs: These are the miscellaneous fees to close a deal. These costs include legal fees, appraisals, inspections, 3rd third-party reports.
Stabilized Cap Rate Today: What do you think the actual cap rate is for the property of interest, assuming it is fully stabilized and in good shape from a structural/maintenance standpoint? A cap rate today will help determine the residual cap rate upon sale.
Increment/Year: How much will the cap rate increase each year? Conservative underwriting should use a higher residual cap rate at the sale than today's. In this example, if we think the cap rate today is 5.50% and will increase at 0.10% annually in five years, our residual cap rate would be 6.00% (5.50% + 0.10%*5).
You can learn more about our methodology for calculating residual sale proceeds.
Brokerage Commission: Typically, you hire a broker to sell the property when you are ready to dispose of it. They typically try to make anywhere from $75,000-$100,000 on a minor deal to $300,000-$400,000 on a larger institutional-sized property.
Other Closing Costs Upon Sale: Includes Deed Tax, legal fees, and bank fees, among other miscellaneous items.
Pricing Metrics, Returns, & Cap Rates
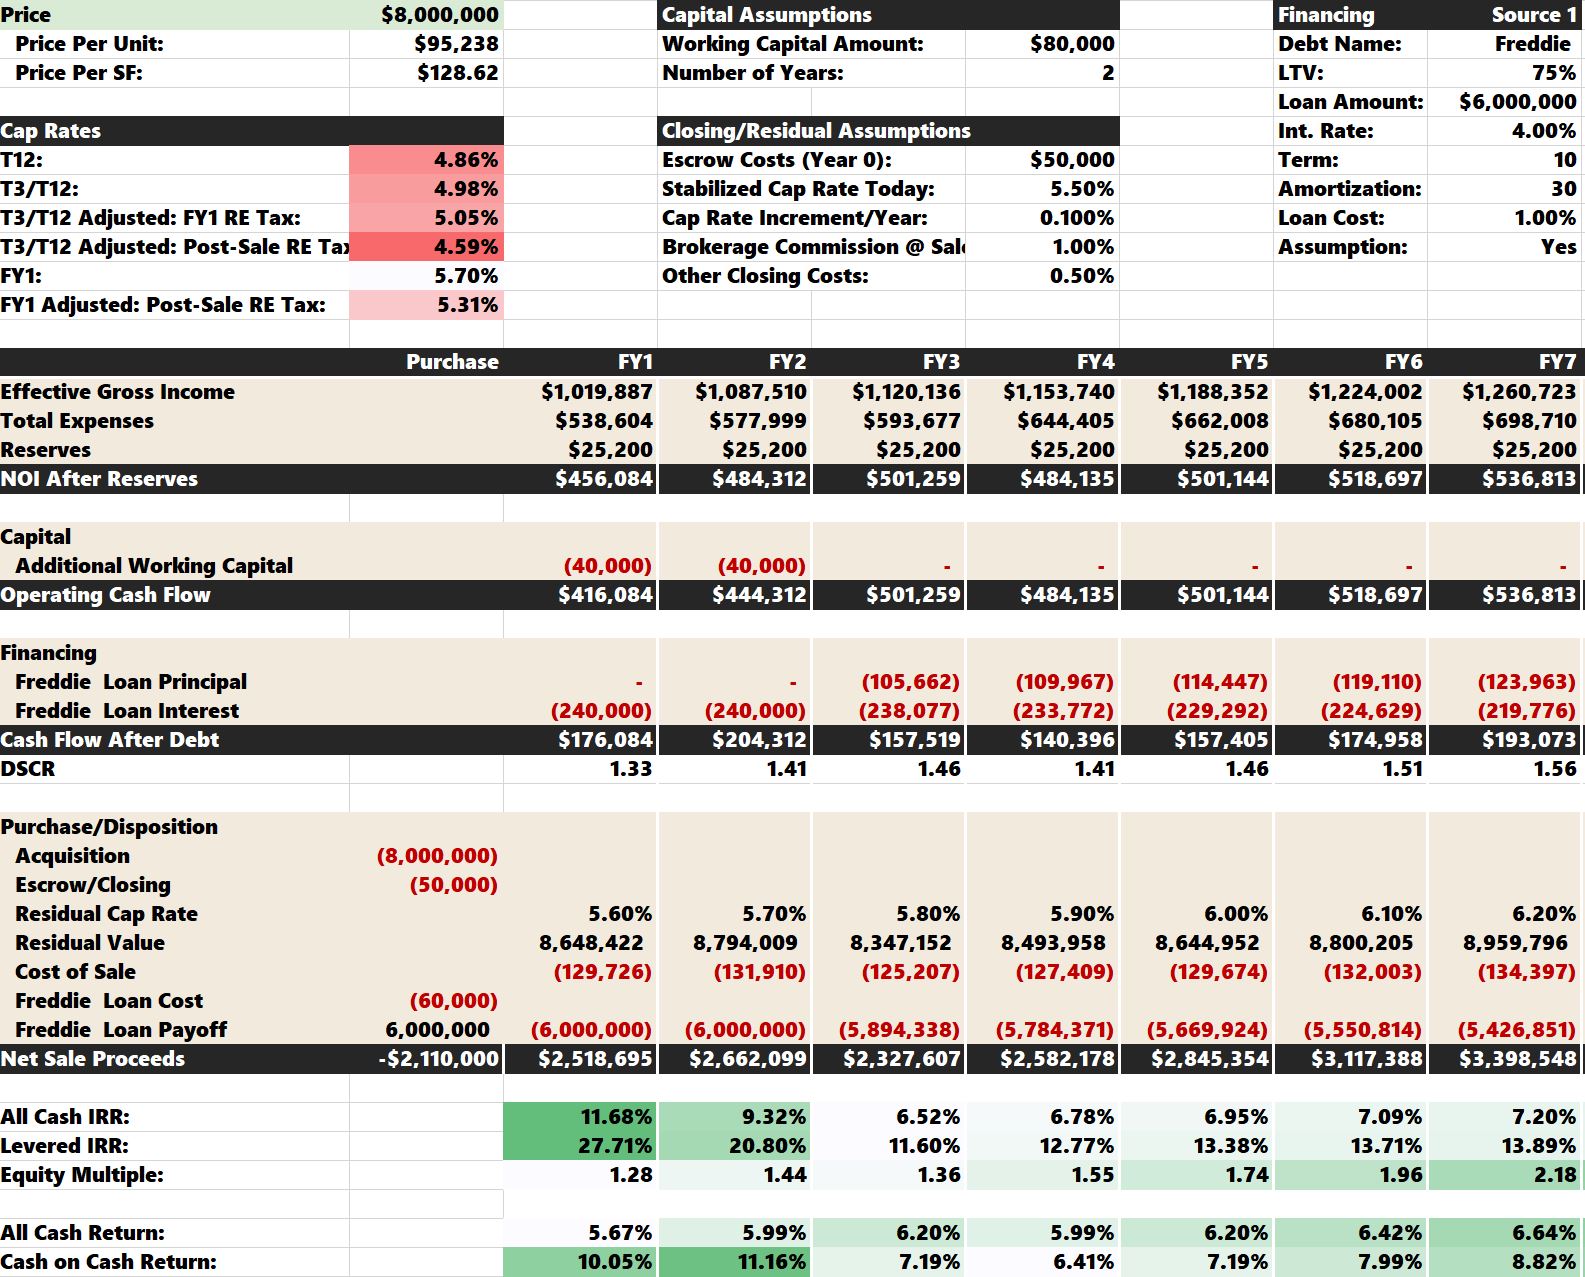
The Pricing section is pretty much just a summary of various deal metrics. The spreadsheet calculates different cap rates, and you can select via a drop-down list what cap rates you want to present. Real Estate Tax adjustments after purchase can have a massive impact on net operating income (NOI). Many astute investors always want to understand “Tax-Adjusted” cap rates on both the historical and pro forma NOI.
You can also adjust the Hold Period and see how it affects the Leveraged IRR and Equity Multiple.
Financing Assumptions
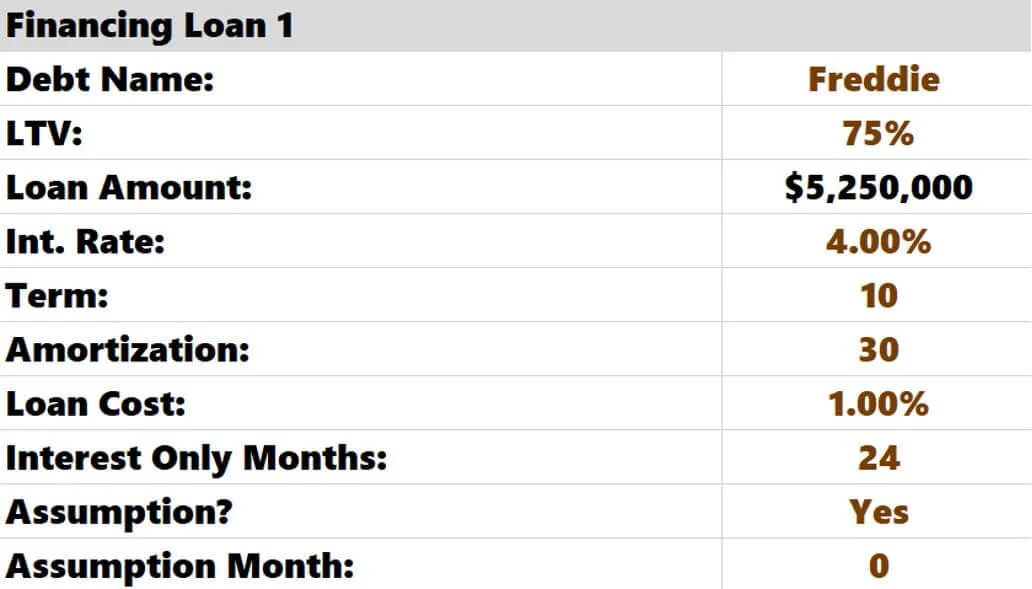
Finally, you input your financing terms on this page (interest rates, loan amount, amortization). The real estate spreadsheet supports two different loans.
If you are assuming a loan, you can select “Yes” in the last row, and the multifamily analysis spreadsheet will ask you to enter what month this takes place.
Monthly payments are calculated automatically for both free and clear assumption scenarios. The “Debt” tab summarizes all debt information.
You can input a second financing tranche, commonly used for supplemental financing or seller financing, in the “Financing Loan 2” section.
Loan #2 Creatively: A customer recently showed me how to use the Loan #2 assumption to account for a preferred equity arrangement.
Summary of Residual Investment Metrics
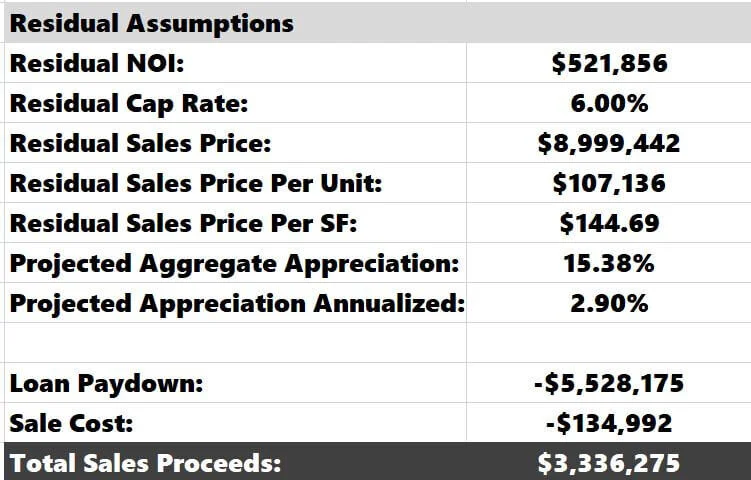
An essential aspect of every multifamily project is analyzing the projected reversion sale value. This amount is determined by the residual cap rate you set above. You can review future sale metrics and the appreciation realized during ownership (gross and annual).
Unit Mix Assumptions
You will enter all the floor plans, unit counts, square footage, and rents from the rent roll.
You can delete or insert rows as necessary. If you add unit types, verify that all Totals and averages include the updated information.
Note: Check out these articles If you need to underwrite adding additional units to the current unit mix or combining smaller units into one more significant rental.
Commercial: If there’s a mixed-use component, you can also enter commercial income here.
Completing a rent comp survey and understanding the rental upside at the subject property is critical at this juncture.
Financials
This tab is where you’ll be spending most of your time. The apartment spreadsheet breaks down financials into three pieces:
Historical Financials
Assumptions for Real Estate Proforma
Proforma Cash Flows
Historical Financials
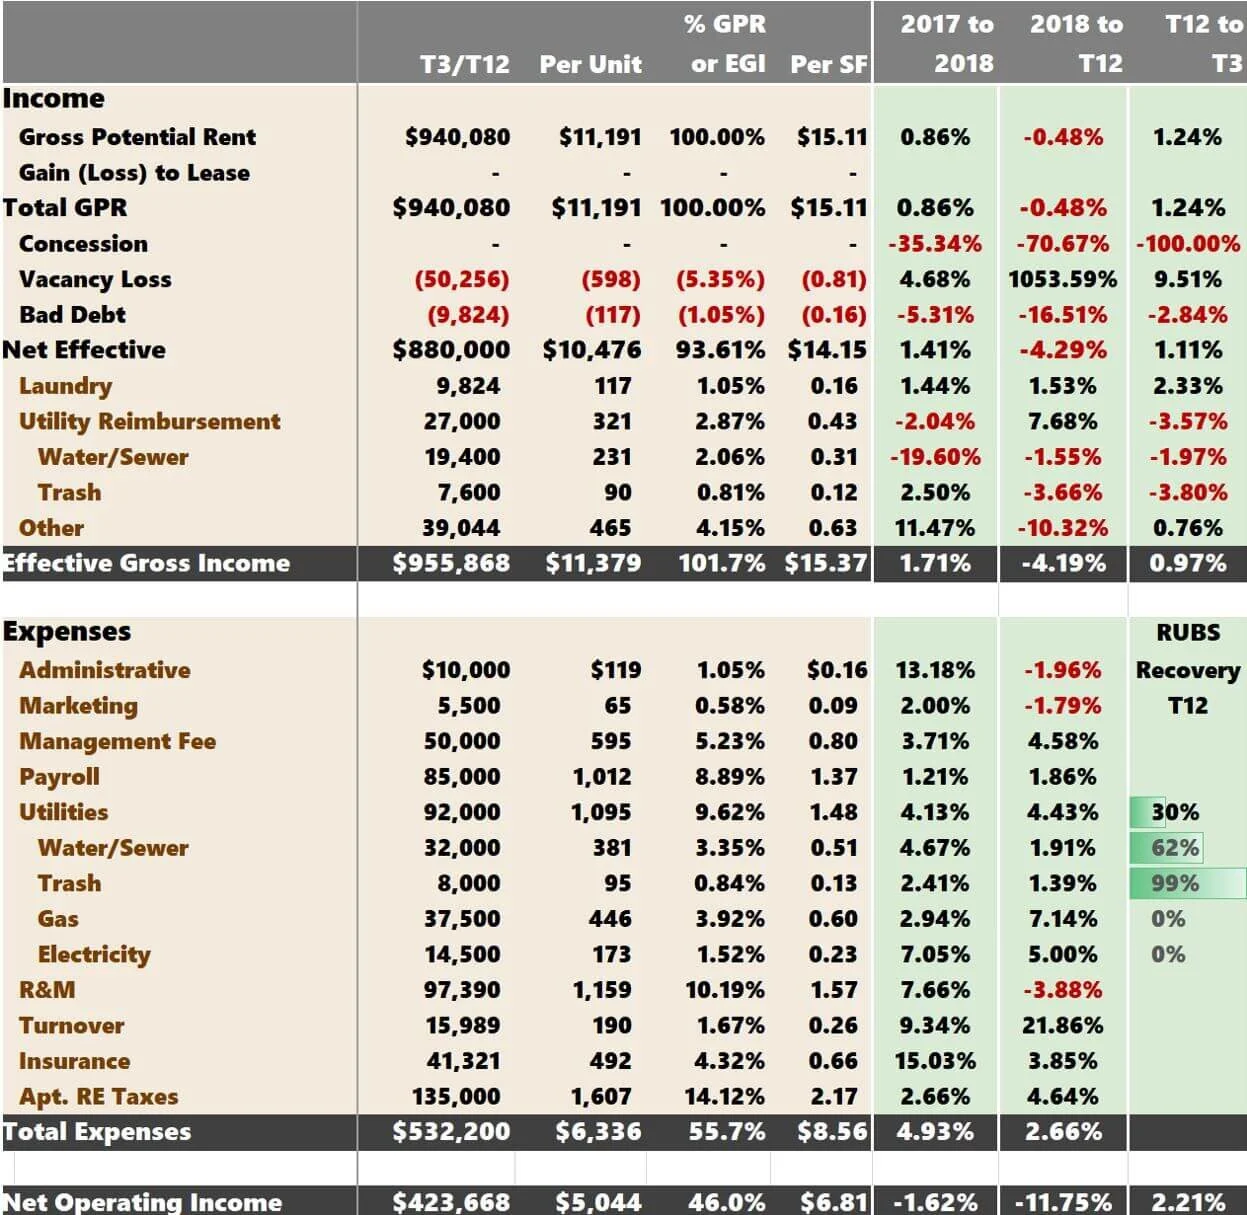
This is where you input the property's historical profit and loss data (P&L).
You should adjust all brown and orange (for the negative numbers). Optimally, the current Trailing 12 Month Financials (T12) will be broken down monthly, as well as the prior two years of financial information. If this is not the case, you can hide or delete unnecessary columns. For example, I would likely hide that column if no 2017 operating information was available, so it didn’t distract me.
The Trailing Three (T3) Header is tinted pink, so you know to enter only three months of data. You could do a T6, a T2, or whatever your preferred viewpoint is. Ensure you update the header and enter the corresponding months’ data.
You can delete any unnecessary rows. I hide them, but removing them is fine and will not adversely affect any calculations.
After you have keyed the historical data, you can see the annualized T3/T12 broken down in a few different ways. Many investors love breaking down line items on a “per unit” basis. I am one of them. Looking at revenue items as a % of GPR is helpful. Looking at expense items as a % of Effective Gross Income (EGI) is common, especially for Management Fees. I am not a big “Per SF” guy, but some investors (especially developers) favor this metric.
The green columns show the year-over-year historical trends. Historical EGI has been all over the place, which has caused the NOI to fluctuate wildly.
Note: I’ve since deleted the “RUBS Recovery Charts” as they tended to have issues.
Now, it’s time to enter your real estate proforma assumptions. Let’s start with Year 1.
Real Estate Proforma Year 1 Assumptions
For each line item, the template allows three options. You can make your assumption by:
Increasing/Decreasing as % over the latest historical amount (T3/T12 amount in this case)
As a % of GPR for revenue and as a % of EGI for expenses
Per unit
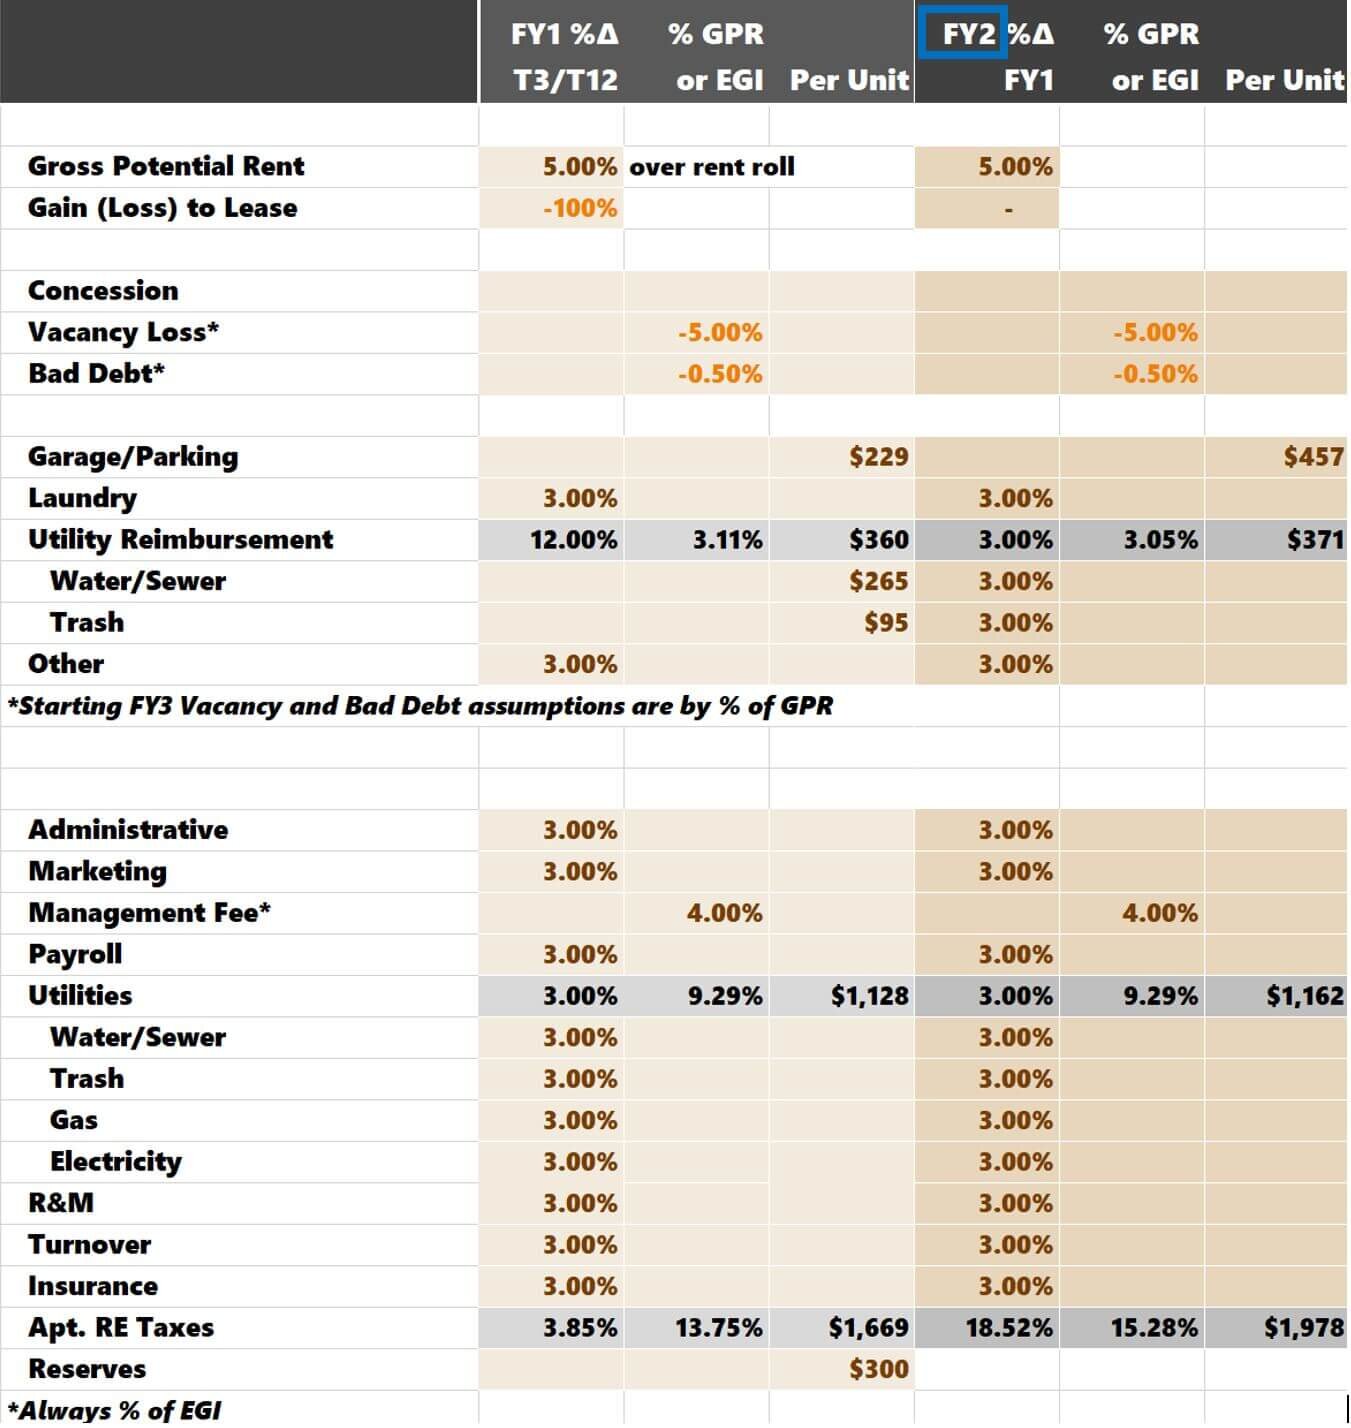
With Gross Potential Rent (GPR), you only have one option. The template will take the current monthly rent from the “Unit Mix” tab, annualize it, and increase it by 5%, as dictated above. Ideally, you’ll have completed a rent comp survey that supports this assumption and have a handle on how rents in your market compare to the cost of homeownership.
I decrease loss to lease (or gain to lease) by 100%. I don’t care what the difference is between the market rents and the actual in-place rents. I want to start where the actual rents are at TODAY. Therefore, I always eliminate loss to lease in the proforma.
Rental Concessions: You can see above that there are no concessions in the proforma because no assumptions are being made. If you leave all three columns blank, the proforma's result will be $0.
Vacancy Loss: Vacancy Loss is a percentage of GPR. This mindset is the most intuitive way to think about how 99% of people will underwrite it. Bad debt is the same.
Garage Parking: Historically, ownership has not been charged for parking. I think there is the potential to do so. Other comps in the area are charging $40 -$50 for a garage spot. I think I can charge 40 units (about half) $40 per month in year one. The per-unit assumption is $40*40*12/84 = $229.
Laundry: I am merely increasing the T3 laundry amount by 3%.
Utility Reimbursement: Since publishing this blog post, I have updated the template, and the Utility Reimbursement assumptions are no longer gray cells. You can enter utility rebills individually (water, trash, gas, etc. ) or in bulk (grouped as one). The same goes for Utility Expenses below.
Commercial: While there’s no retail in this example, you could also underwrite it in this section.
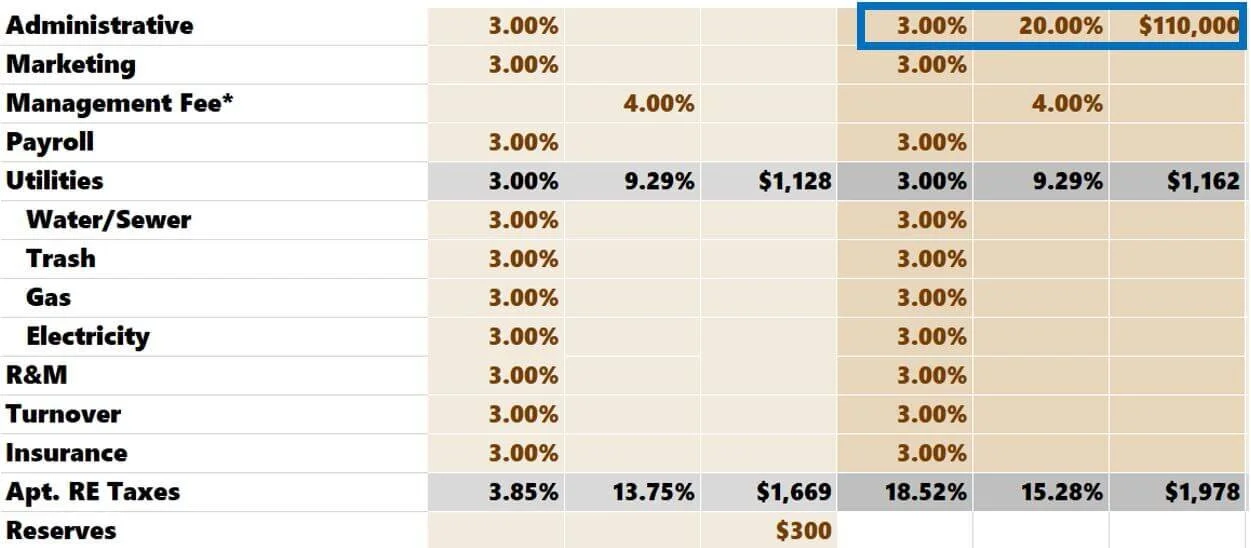
Operating Expenses: I am increasing each line item by 3% over T12 for most expenses. I am saying that the Management Fee is 4% of EGI and that Reserves are $300 per unit. Real estate taxes are gray because the spreadsheet calculates them elsewhere. We will get to that shortly.
Any gray cell can be left alone.
Real Estate Proforma Year 2 Assumptions
Again, you can make assumptions by:
Increasing/Decreasing as % over the FY1 amounts
As a % of GPR for revenue and as a % of EGI for expenses
Per unit
The assumptions are similar to those I made in Forecast Year 1 (FY1). Parking should stabilize in FY2, and I should see the benefit of charging for 80 garage sports per month at $40 ($40*80*12/84 = $457 per unit). Reserves will continue to be $300 per unit each year. Investors rarely underwrite an escalator for Reserves.
Note: Excel will read the assumptions from left to right. For example, if I entered:
Excel would use the 3% growth over FY1, ignoring 20% and $110,000. For clarity, ensure you only have one assumption entered for each line item (excluding gray cells, which the apartment spreadsheet calculates automatically).
Real Estate Proforma Years 3+ Assumptions
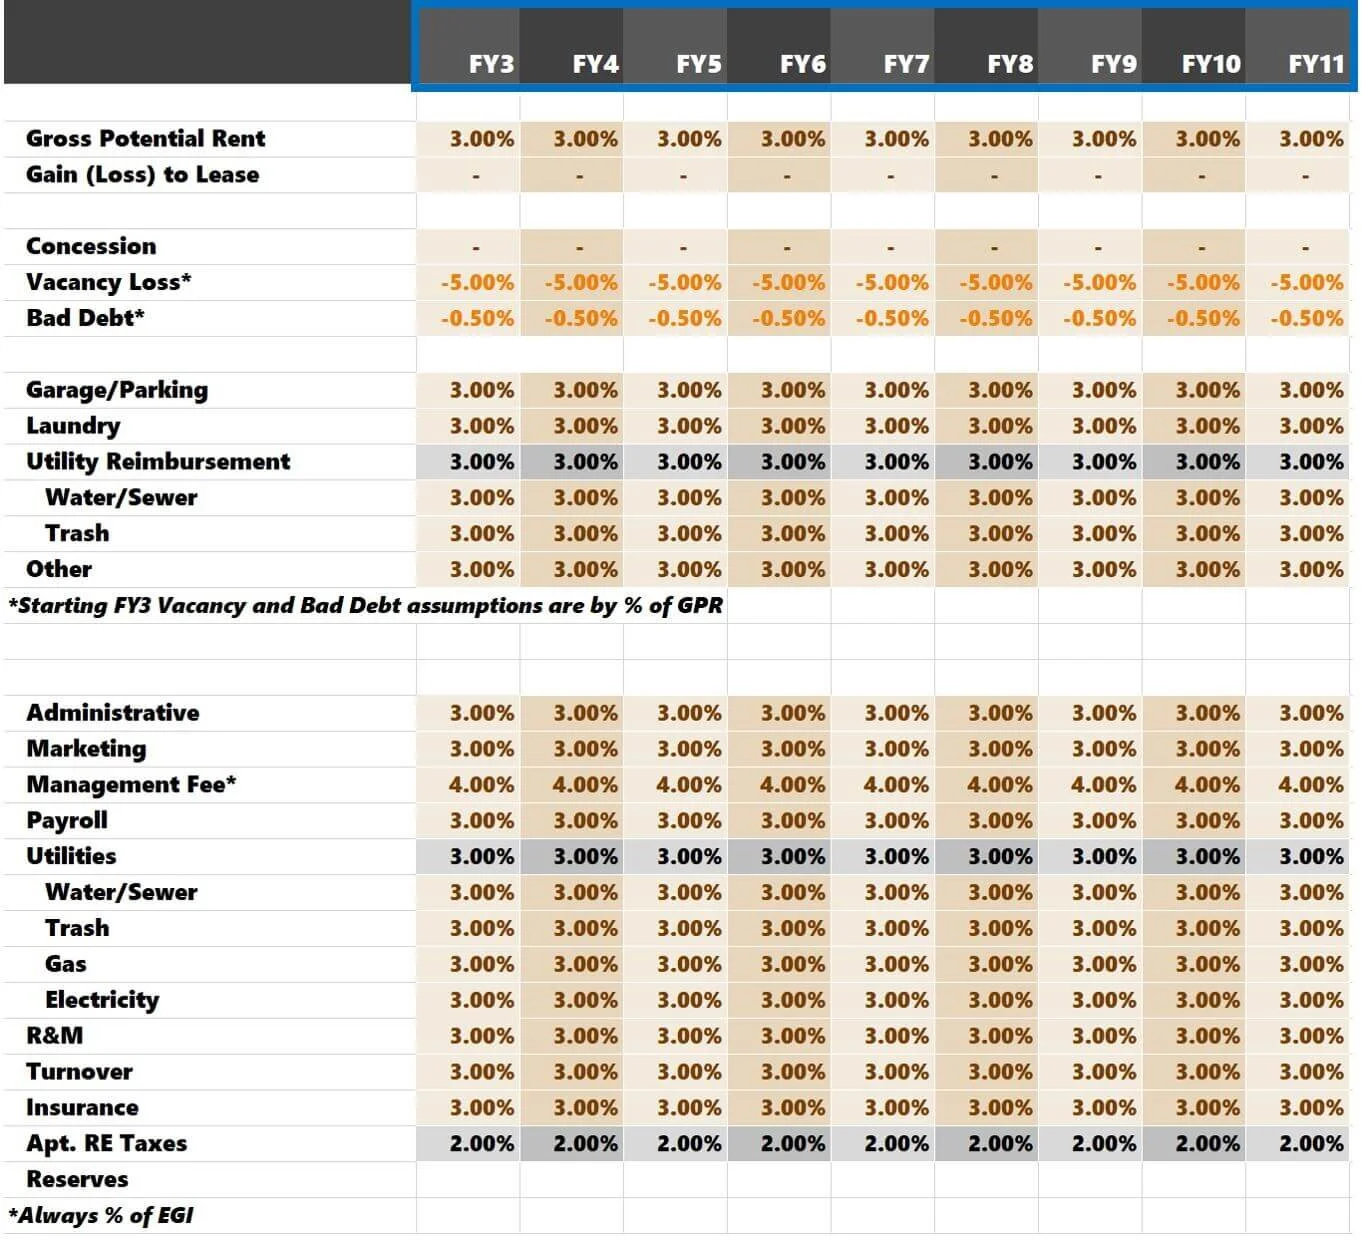
After FY2, the assumptions for the years 3 -11 will be much more inflexible.
You will make every line item assumption a percentage increase (or decrease) over the prior year, except for Vacancy Loss, Bad Debt, and Property Management fees. You make Vacancy and Bad Debt assumptions as a percentage of GPR. Management Fee will be a percentage of EGI. This reminder is noted in the template so you do not forget.
After you enter all the assumptions, you can look at the cash flows that make up the NOI off to the right.
Reading about creating your expense comp database can help you develop a much better feel for reasonable expense assumptions.
Real Estate Tax Assumptions
I’ve analyzed apartment buildings in at least eight different states. Real Estate taxes vary wildly in each one, so I built a real estate analysis that is simple but effective. No matter where you live, you can accurately input real estate taxes for your property.
The two more important things that you must determine when underwriting Real Estate Tax are:
How much reassessment risk is there?
When will this reassessment risk hit your proforma?
For example, let’s say an apartment building’s assessment is $5 million, and you are considering paying $10 million for it. The applicable tax rate is 2.5%. Taxes today are $125,000 (2.5% x $5 million).
If you paid $10 million, how much would the property assessment increase? Would it go to 100% of the sales price? Would it go to 75% of the sales price? If it went to 100%, that would create an additional $125,000 in tax liability than what is currently being paid (2.5% * $10 million = $250,000).
How much time would you have before you see this increase? One year? Two Years? Three? In Minnesota, where I live, it is typically two years (depending on the sale’s timing).
I have a separate article detailing how to underwrite property taxes and evaluate tax comps.
Property Valuation Summary
You’ve entered most of the assumptions, and we can see how the investment metrics look. Just a few more variables are needed, as seen below.
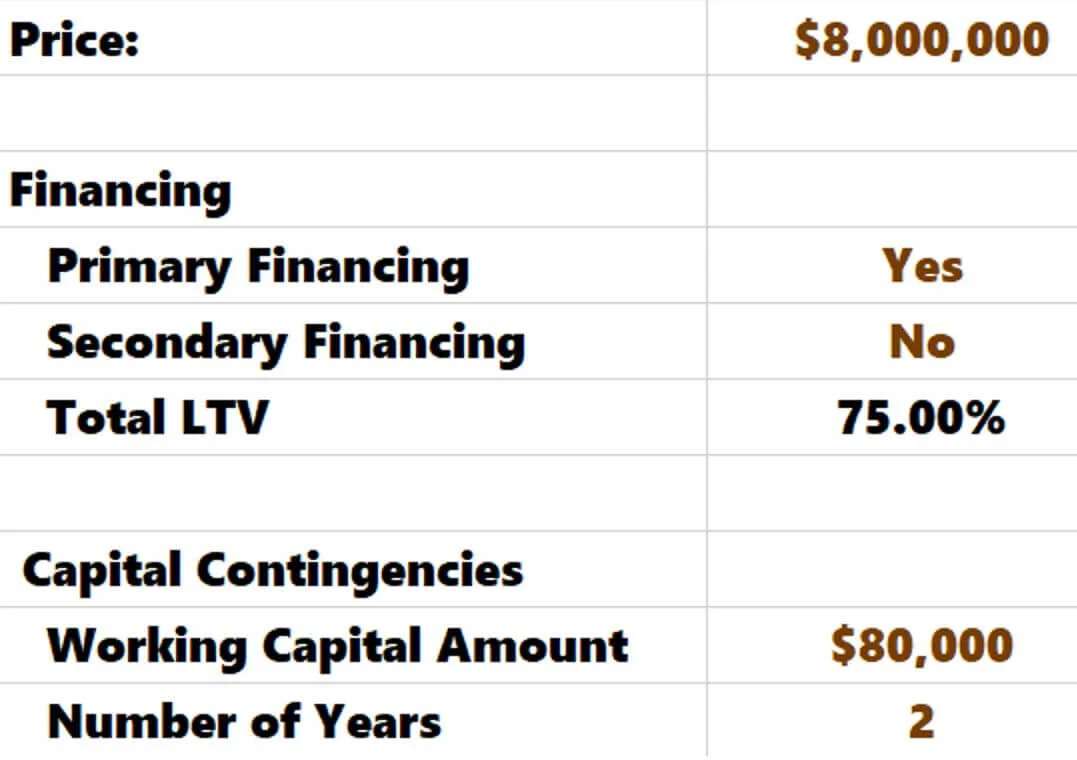
The most important assumption is the price! How much are you willing to pay? You need to determine if you will be using one or two loans for financing. We use one Freddie Mac loan, so I keyed the Secondary Financing as “No.” Finally, it would be best if you made a working capital assumption. I typically run for a property in good shape with approximately $1,000 per unit. For ample deferred capital, I would be closer to $2,000.
Now, let’s analyze the numbers.
The top of the sheet will summarize the pricing metrics and break down a couple of different cap rates. Because of significant real estate tax exposure, the T3/T12 Adjusted: Post-Sale Re Tax dips well into the 4% range! But remember, we underwrote 10% rent growth over the first two years and are phasing in parking income to help hedge that future liability.
In my home market, it was widespread that the winning bidder would pay aggressive cap rates if there was some operating upside at the property. I’m not condoning it; I'm just telling you it happens.
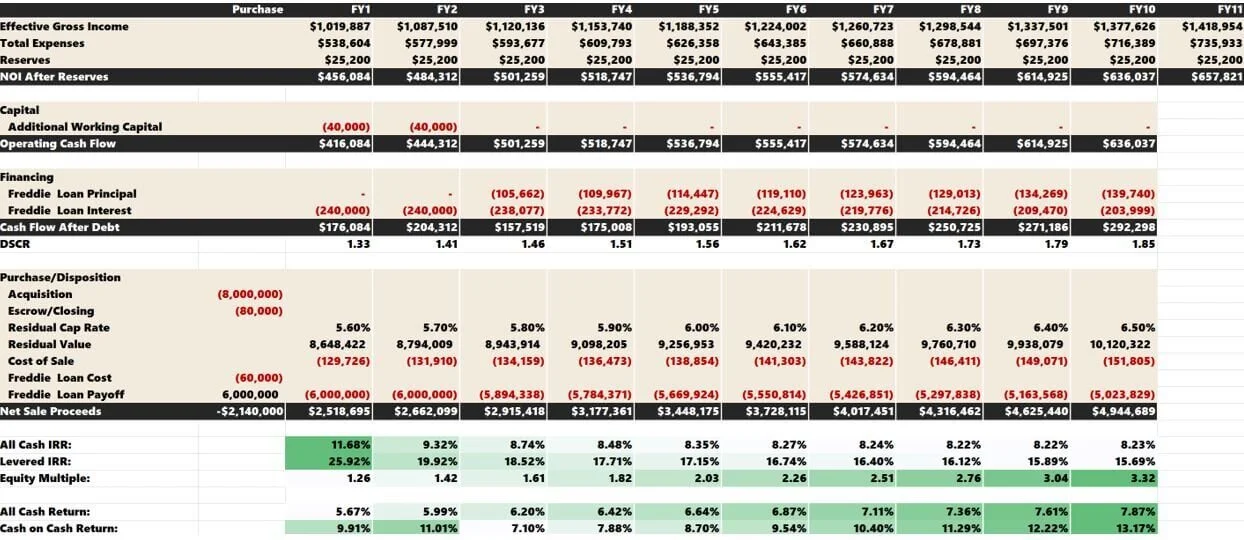
And finally, we can analyze the return metrics. You can see the corresponding IRRs and Equity Multiples for multiple holding periods. For example, a 7-year investment hold would produce a Leveraged IRR of 16.40%. A 10-year investment hold would have a Leveraged IRR of 15.69%.
You can also see the annual cash-on-cash returns summarized at the very bottom.
The “All Cash IRR” and “All Cash Returns” are essential to analyze because they show you how the investment would look if you didn’t utilize debt. It’s crucial to compare the “Leveraged” vs. “All Cash” metrics to ensure that the debt is accretive and boosts your yields. In many cases, deals are over-leveraged and don’t provide much of a lift to returns but exponentially more risk.
You can adjust assumptions from here and see how it changes the returns.
Additional Application: Convert an underwriting template into a hybrid analysis that factors actual historical financial performance and updated future forecasts for optimal 'hold vs. sell' decision-making
Debt
The final tab has the amortization tables and cash flows for the debt service assumptions. This tab doesn’t require you to do anything. While the template defaults to loan-to-value (LTV), an LTC financing assumption is a simple adjustment.
Your proforma analysis should be well on its way at this point. Don’t forget to do a simple test to ensure your property valuation is reasonable.
Template Faults
This multifamily property analysis spreadsheet is an excellent template for starting commercial real estate analysis. You will be able to underwrite a deal confidently. We also offer a “back of the envelope” version, a simple one-page analysis template to quickly vet project potential.
For veteran investors, there are some shortcomings regarding the following business plans.
Multifamily Value-Add
Multifamily Redevelopment
Multifamily Development
Residential Investment
Multifamily Value-Add
This template lacks an analysis module for value-add strategies. The paid Value-Add Model will feature a tab that will allow you to:
Break down your unit mix into original and renovated units.
Come up with a rental premium specific to each floor plan.
Make capital assumptions for each unit type.
Multifamily Redevelopment
This template won’t be suitable for repositioning efforts that require bridge financing and a refinance once the property is stabilized. The paid Redevelopment Model is perfect for messy rebranding efforts.
Multifamily Development
This template isn’t adequate for ground-up construction to adaptive reuse. We offer site visitors:
Residential Investment (Turnkey or “Fix”)
This proforma template won't be the most proficient for smaller properties (1 - 4) units. We offer site visitors:
Partnership-Level Distributions & Fees
The free version only shows project-specific returns. The paid multifamily models (excluding residential) allow you to test different partnership structures and see how the cash flows would affect both Sponsor and LP investors. Acquisition and disposition fees can be crucial to a Sponsor’s business plan.
Miscellaneous Analysis Features
This template lacks creative ways to underwrite capital expenditures, sensitivity analysis, and an investment overview dashboard highlighting all significant investment facets.
Excel Resources
If you're interested in the inner-working of this analysis spreadsheet to maximize its utility with advanced Excel knowledge, we recommend visiting these articles:
We plan to publish more posts about the commonly used Excel functions and the major analysis components within the Tactica multifamily property analysis spreadsheets.


