Stagflation’s Potential Impact on CRE Investing
Stagflation is characterized by an economic period of:
High inflation
Low economic output
High unemployment
Rising prices in tandem with low employment and economic output is truly a worst-case scenario.
When this article was last updated in February 2025, the U.S. economy was far from stagflation territory. Inflation was at 3.0%, unemployment was near historic lows, and GDP was positive but trending down. The article noted that tariffs, immigration policy, and increased spending could accelerate inflation in the upcoming quarters.
Fast-forward to April 2026, and the stagflation conversation has taken on new urgency. A Supreme Court ruling dismantled the IEEPA tariff regime; a U.S.-Israeli war with Iran has caused a major oil shock reminiscent of the 1970s; the labor market has deteriorated, with the economy shedding 92,000 jobs in February 2026; and GDP growth slowed to just 0.7% in Q4 2025. This update adds over a year of new data, charts, and analysis to the original piece.
Contents
1970s Stagflation
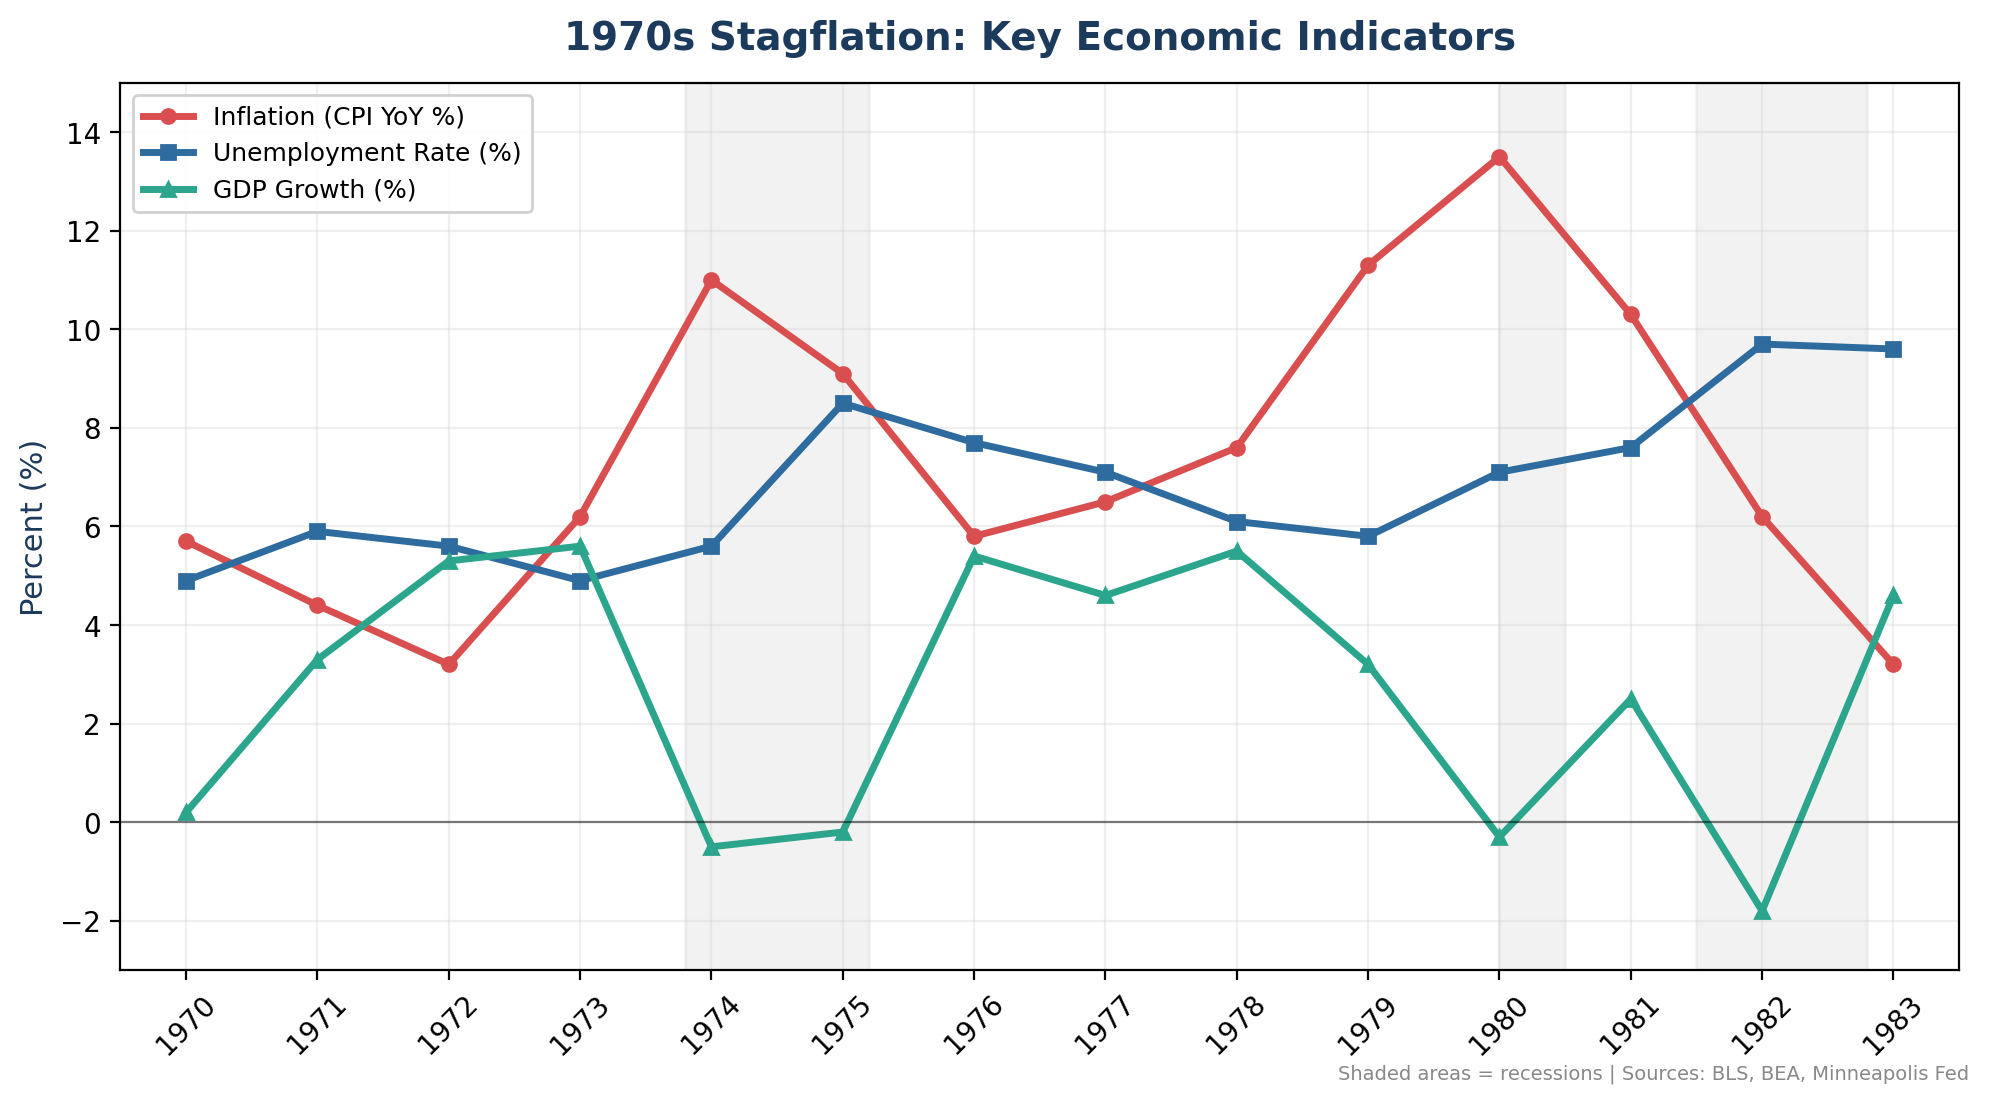
The last period of stagflation took place in the 1970s, specifically from 1973 to 1982. An oil embargo that led to soaring energy costs reverberated through the economy, causing significant price hikes for American consumers. Three recessions took place during this period:
Q4 1973 - Q1 1975
Q2 1979 - Q3 1980
Q2 1981 - Q3 1983
Between 1975 and 1979 (recessions #1 and #2), inflation and unemployment remained elevated above historical norms.
Inflation had multiple double-digit years, reaching 13.5% in 1980 (minneapolisfed.org).
Unemployment (monthly) reached 9% in 1975 and spiked again to 10.8% in 1982 (stlouisfed.org).
GDP growth was negative for four years during the decade, bottoming out at -1.82% in 1982 (stlouisfed.org).
Ultimately, a fed funds rate of nearly 20% (the Volcker shock, see image below), an oil glut, and fiscal reform finally curbed the lingering stagflation in the early 80s.
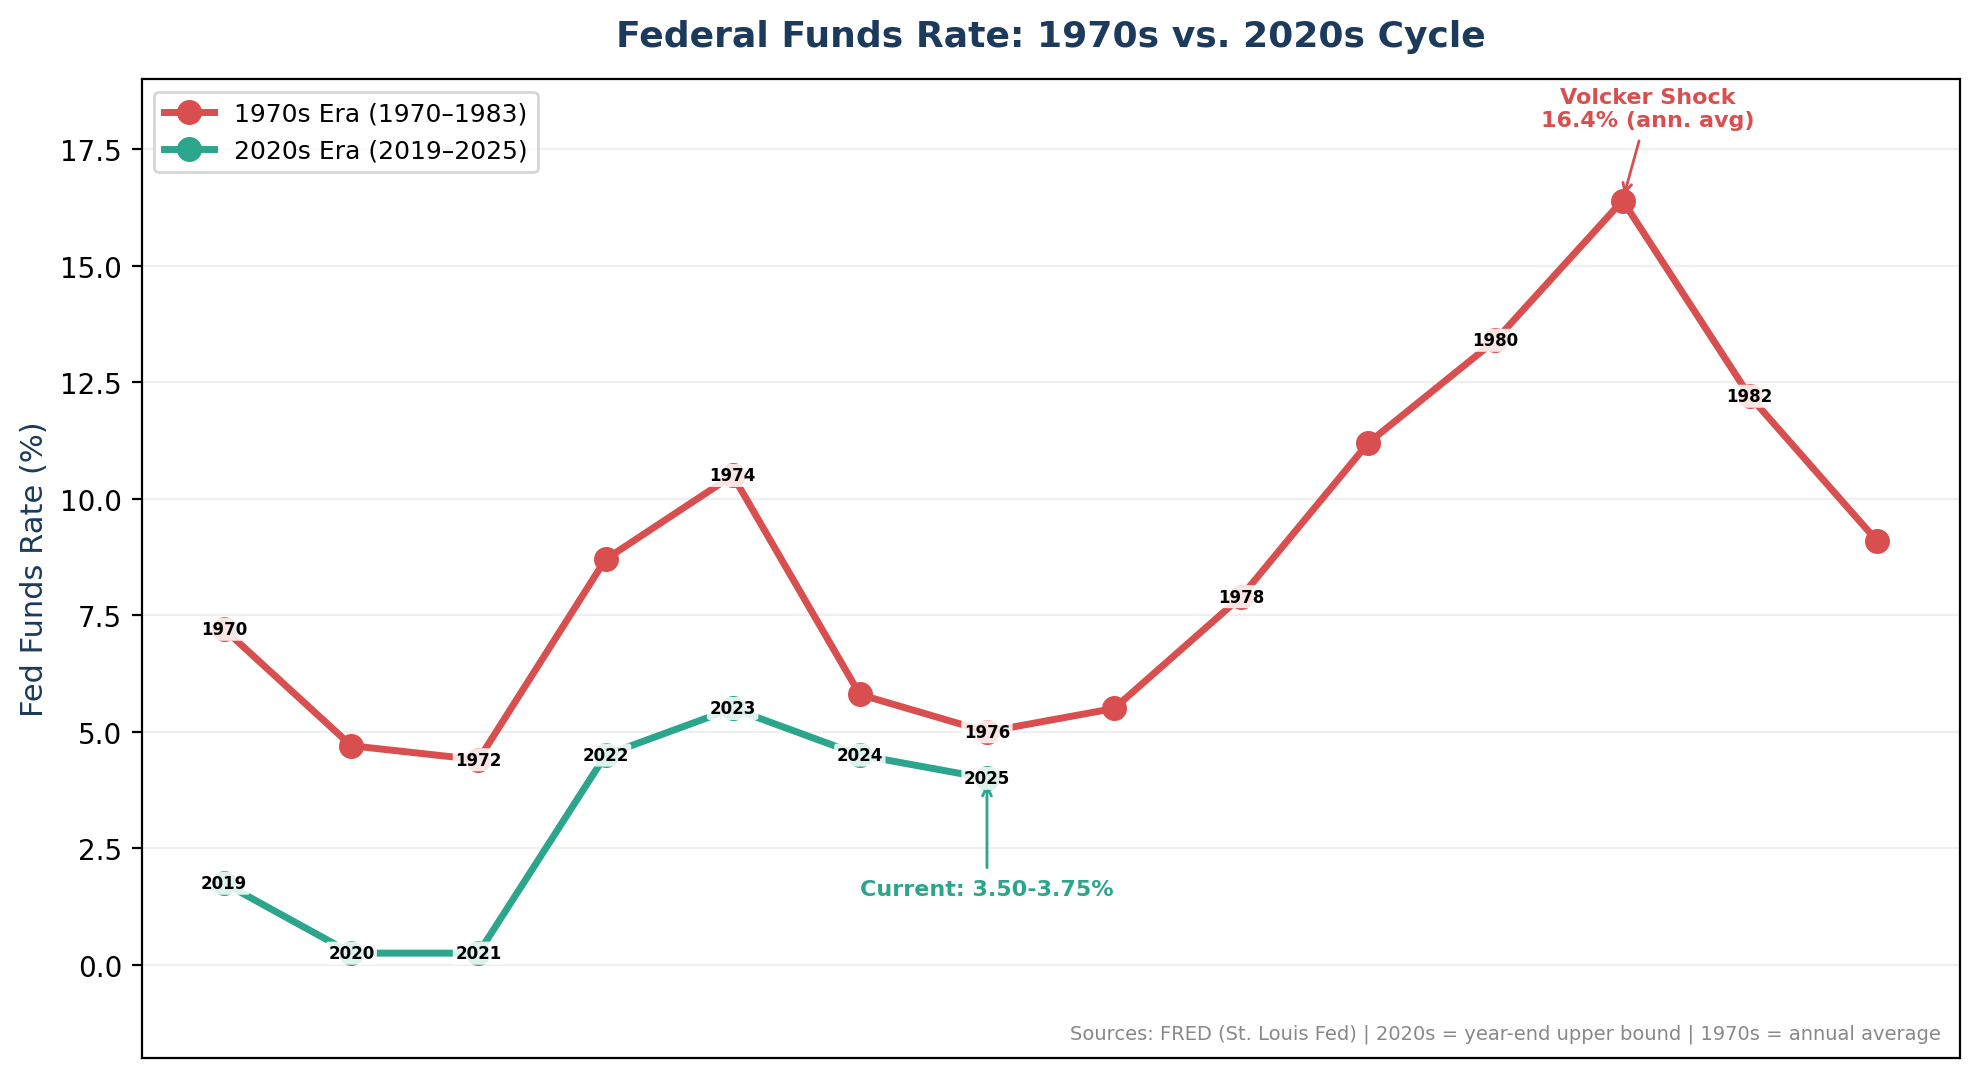
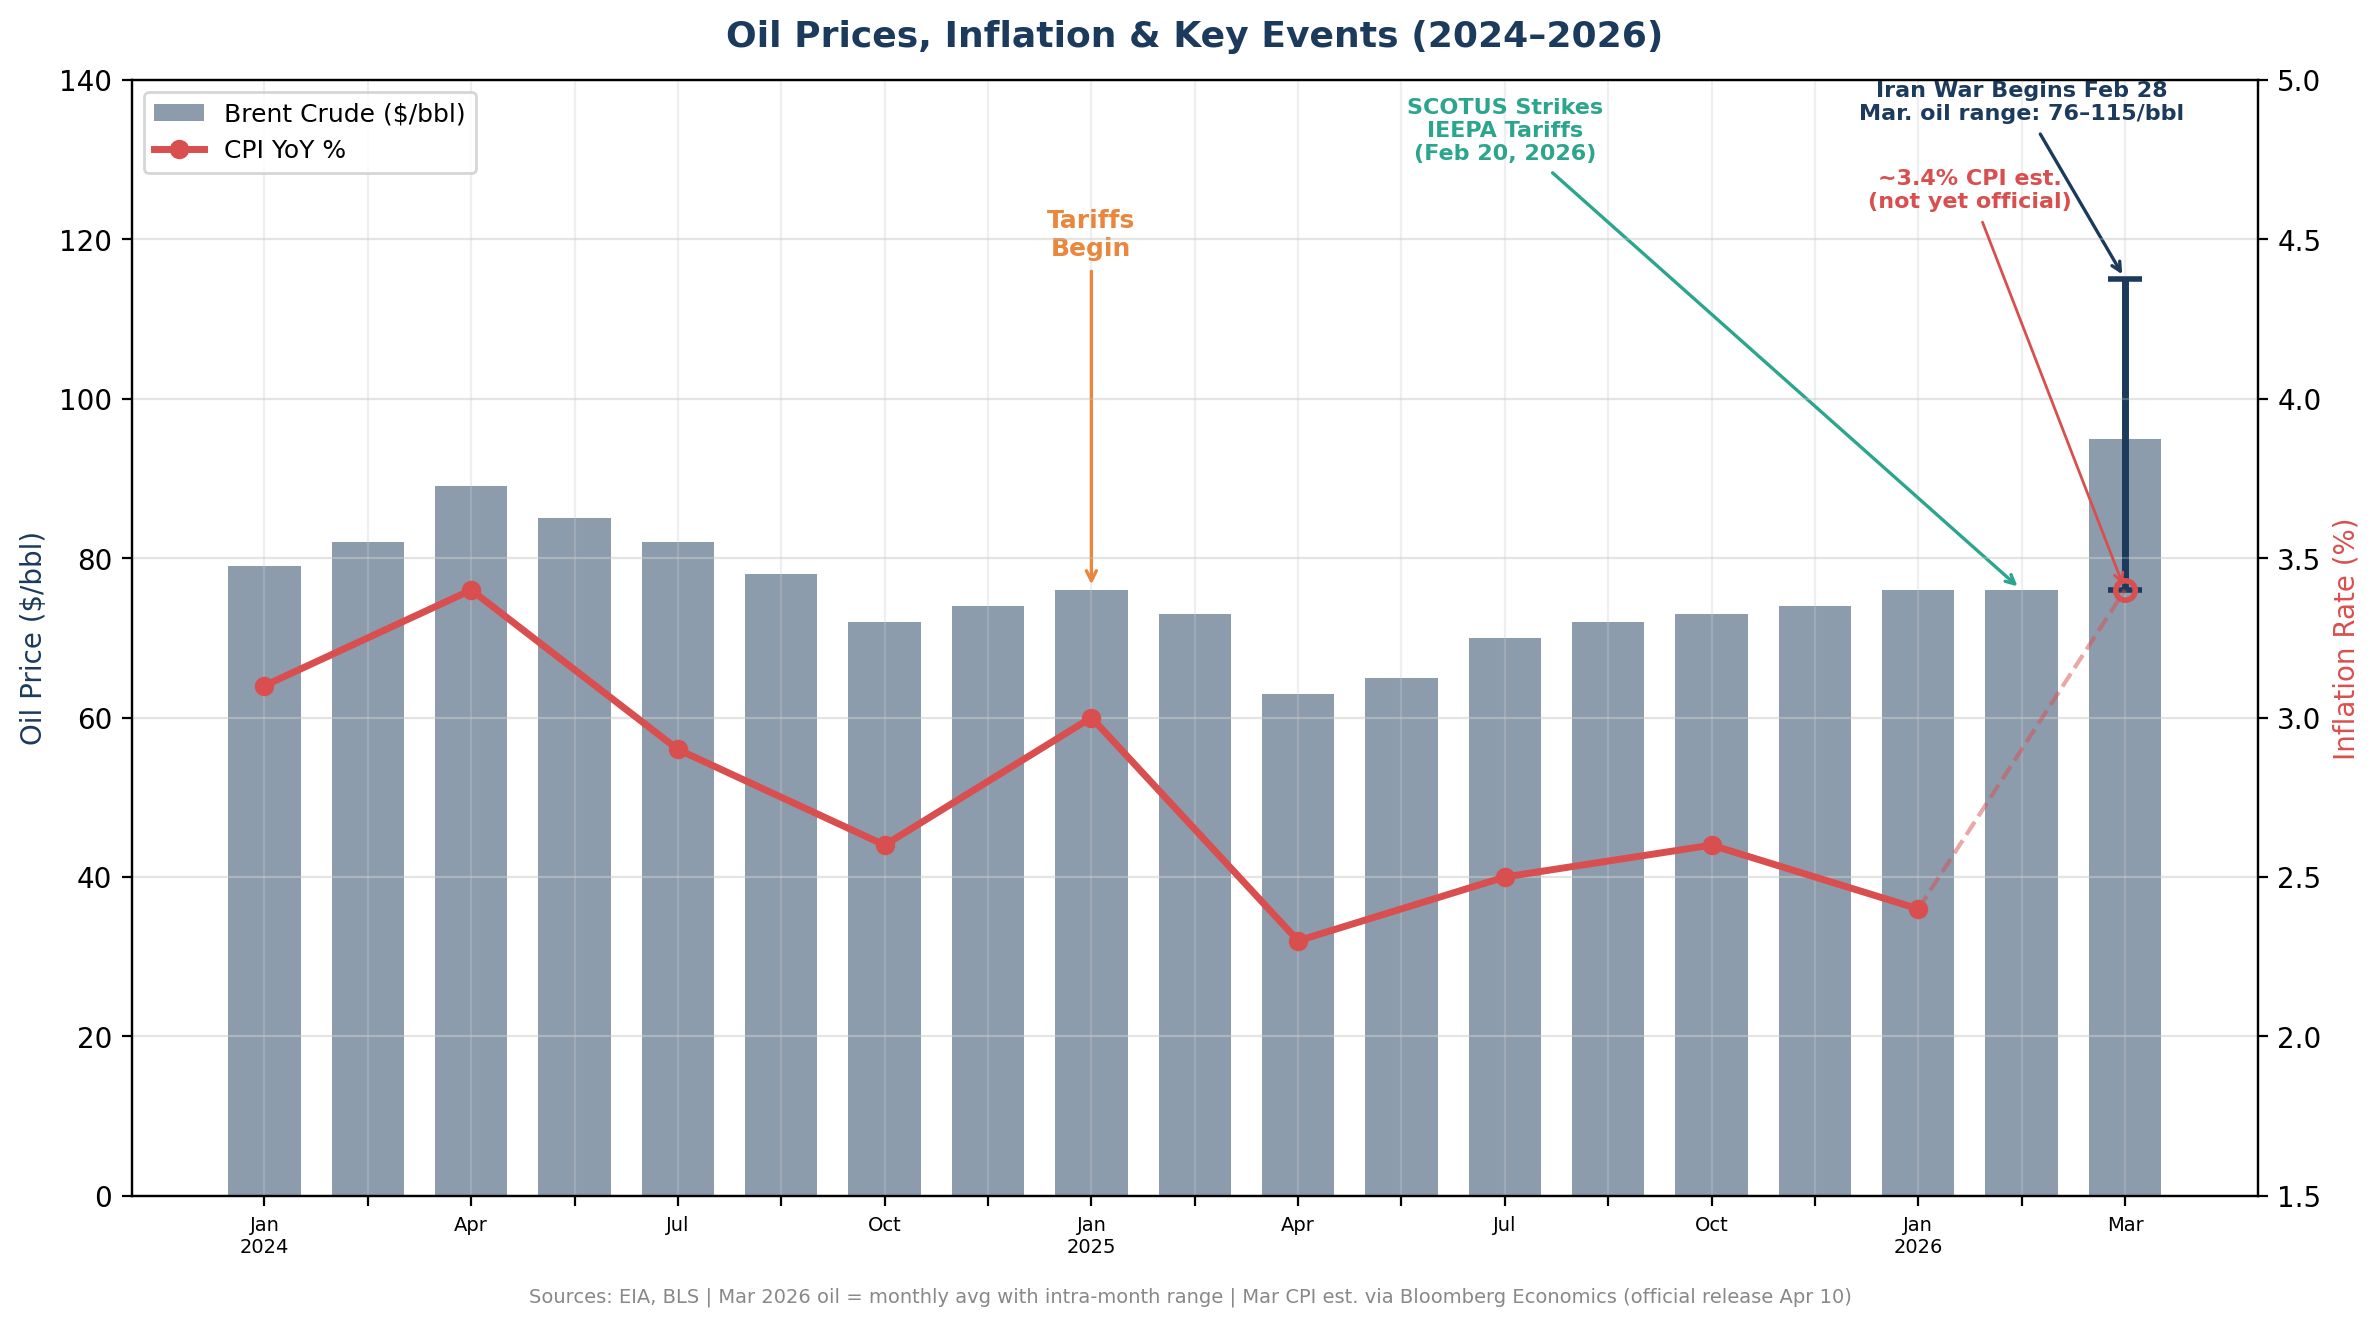
As the Fed Funds chart shows, the current rate-hiking cycle has been significant (from 0.25% to a peak of 5.50% in 2023), but it pales in comparison to the Volcker-era rates that reached nearly 20%. The Fed cut rates three times in 2025, bringing the target range to 3.50–3.75%, where it remains as of March 2026. The war in Iran has complicated the Fed’s path forward, as rising oil prices put upward pressure on inflation while the weakening labor market argues for further easing.
Stagflation Risk Post-Pandemic
Since the pandemic, it's been a battle to rein in inflation. While the Fed has aggressively raised rates and cut its balance sheet (quantitative tightening) over the past few years, the employment market has remained resilient. GDP has surprised on the upside multiple quarters, and only recently have cracks started to show.
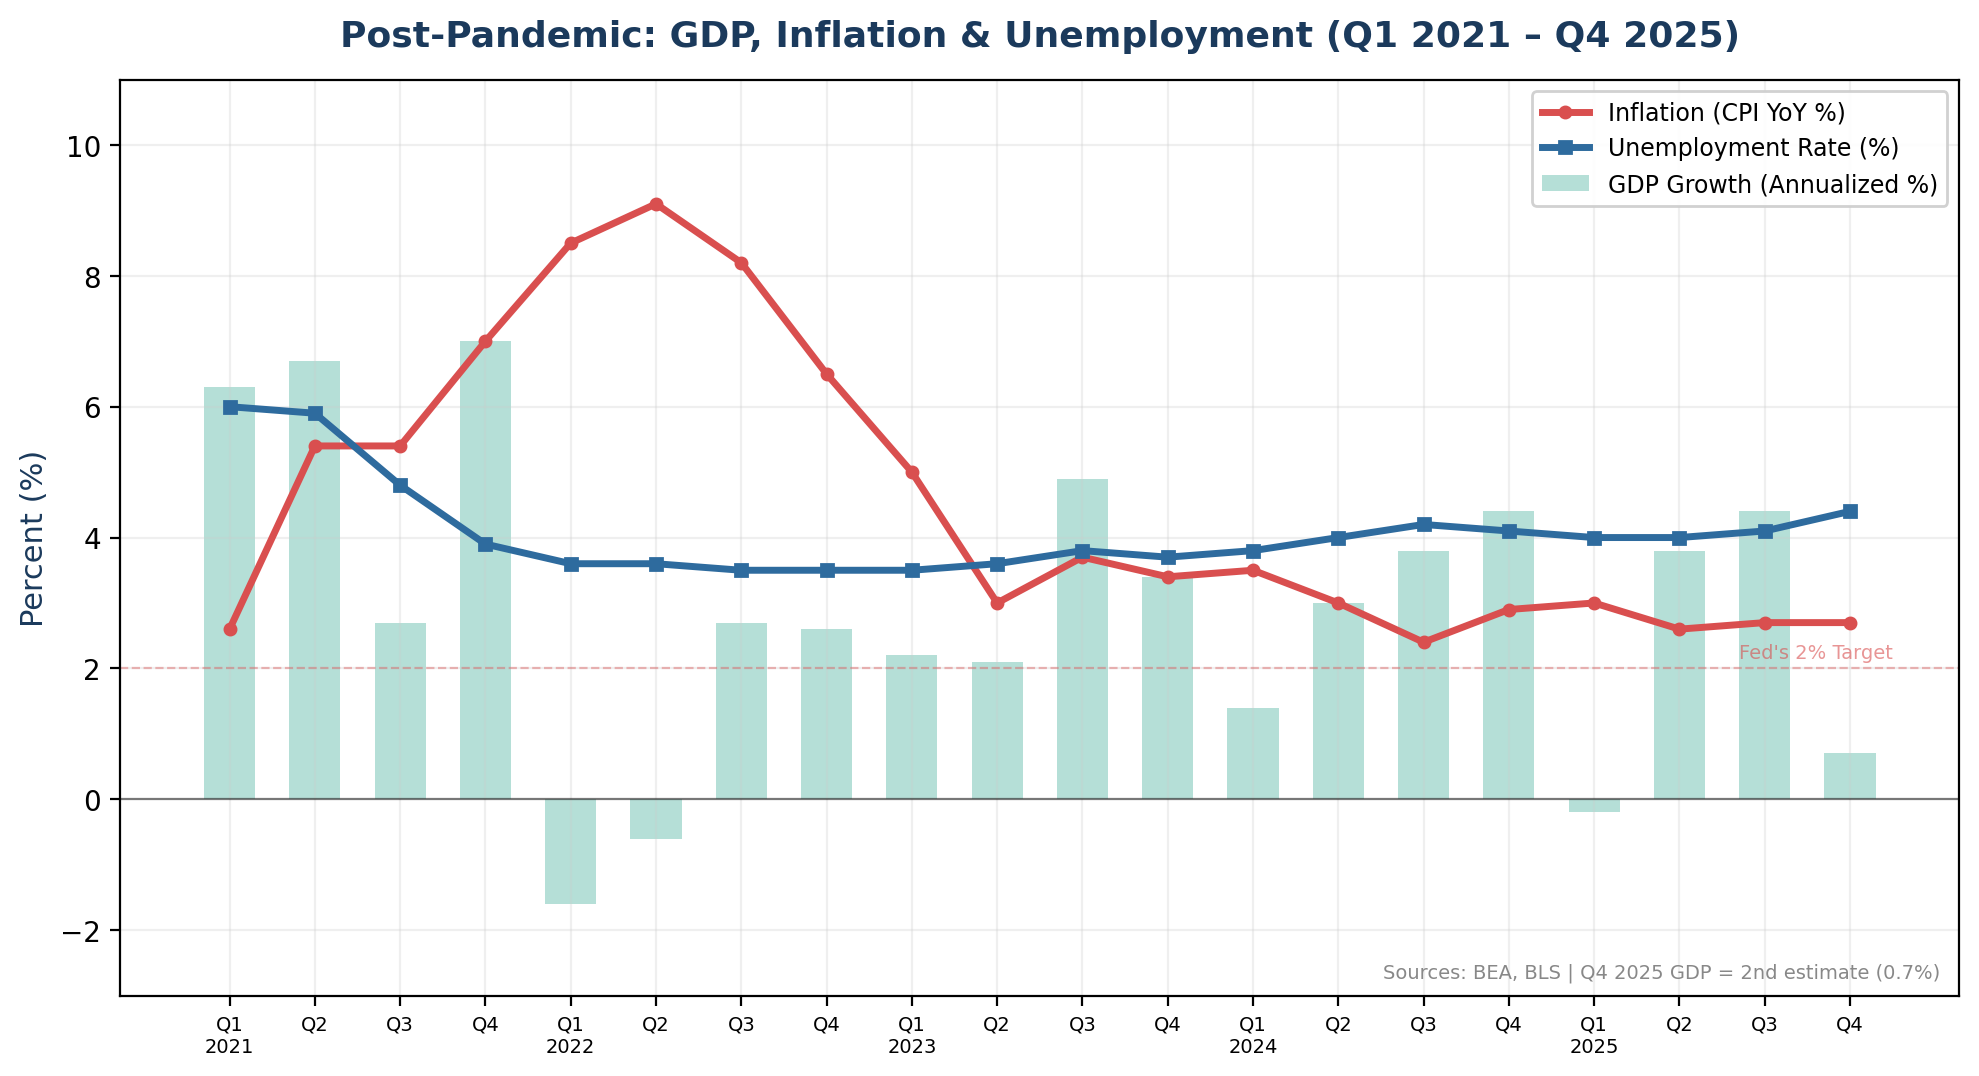
Updated Indicators (Through Q4 2025)
Inflation: CPI inflation has fallen meaningfully from the 3.0% reading at the time the article was last updated (January 2025). The annual rate fell to 2.4% as of February 2026, with core inflation at 2.5%—its lowest since March 2021. However, the war in Iran is expected to push energy prices higher, pushing the March 2026 CPI significantly higher. EY estimates that surging gasoline prices will push headline CPI inflation toward 3.3% in March, up sharply from 2.4% in February. The disinflation progress made in 2025 is now at serious risk of reversal.
GDP: Q3 2025 was a strong quarter (4.4% annualized), but Q4 2025 GDP decelerated sharply to just 0.7% in the BEA’s second estimate—well below the 3.0% consensus forecast. For the full year 2025, the economy expanded 2.1%, down from 2.8% in 2024. The deceleration was partly caused by the longest government shutdown in U.S. history (October–November 2025), which subtracted nearly a full percentage point from Q4 growth. Deloitte forecasts 2.2% GDP growth for 2026, though this was estimated before the Iran war began. As of April 1, 2026, the Atlanta Fed’s GDPNow model estimates Q1 2026 GDP growth at just 1.9% annualized—down from 3.1% in late February—reflecting the rapid deterioration in consumer spending amid the oil shock.
Unemployment: This is where the picture has deteriorated most. Unemployment rose from 4.0% in January 2025 to a peak of 4.5% in November 2025, then eased slightly before climbing back to 4.4% in February 2026. More concerning, nonfarm payrolls fell by 92,000 in February 2026—a surprise miss against expectations of +60,000. The three-month average job gain through February was just 8,000 per month.
Tracking the current trends against the 1970s data, the comparison has become more meaningful:
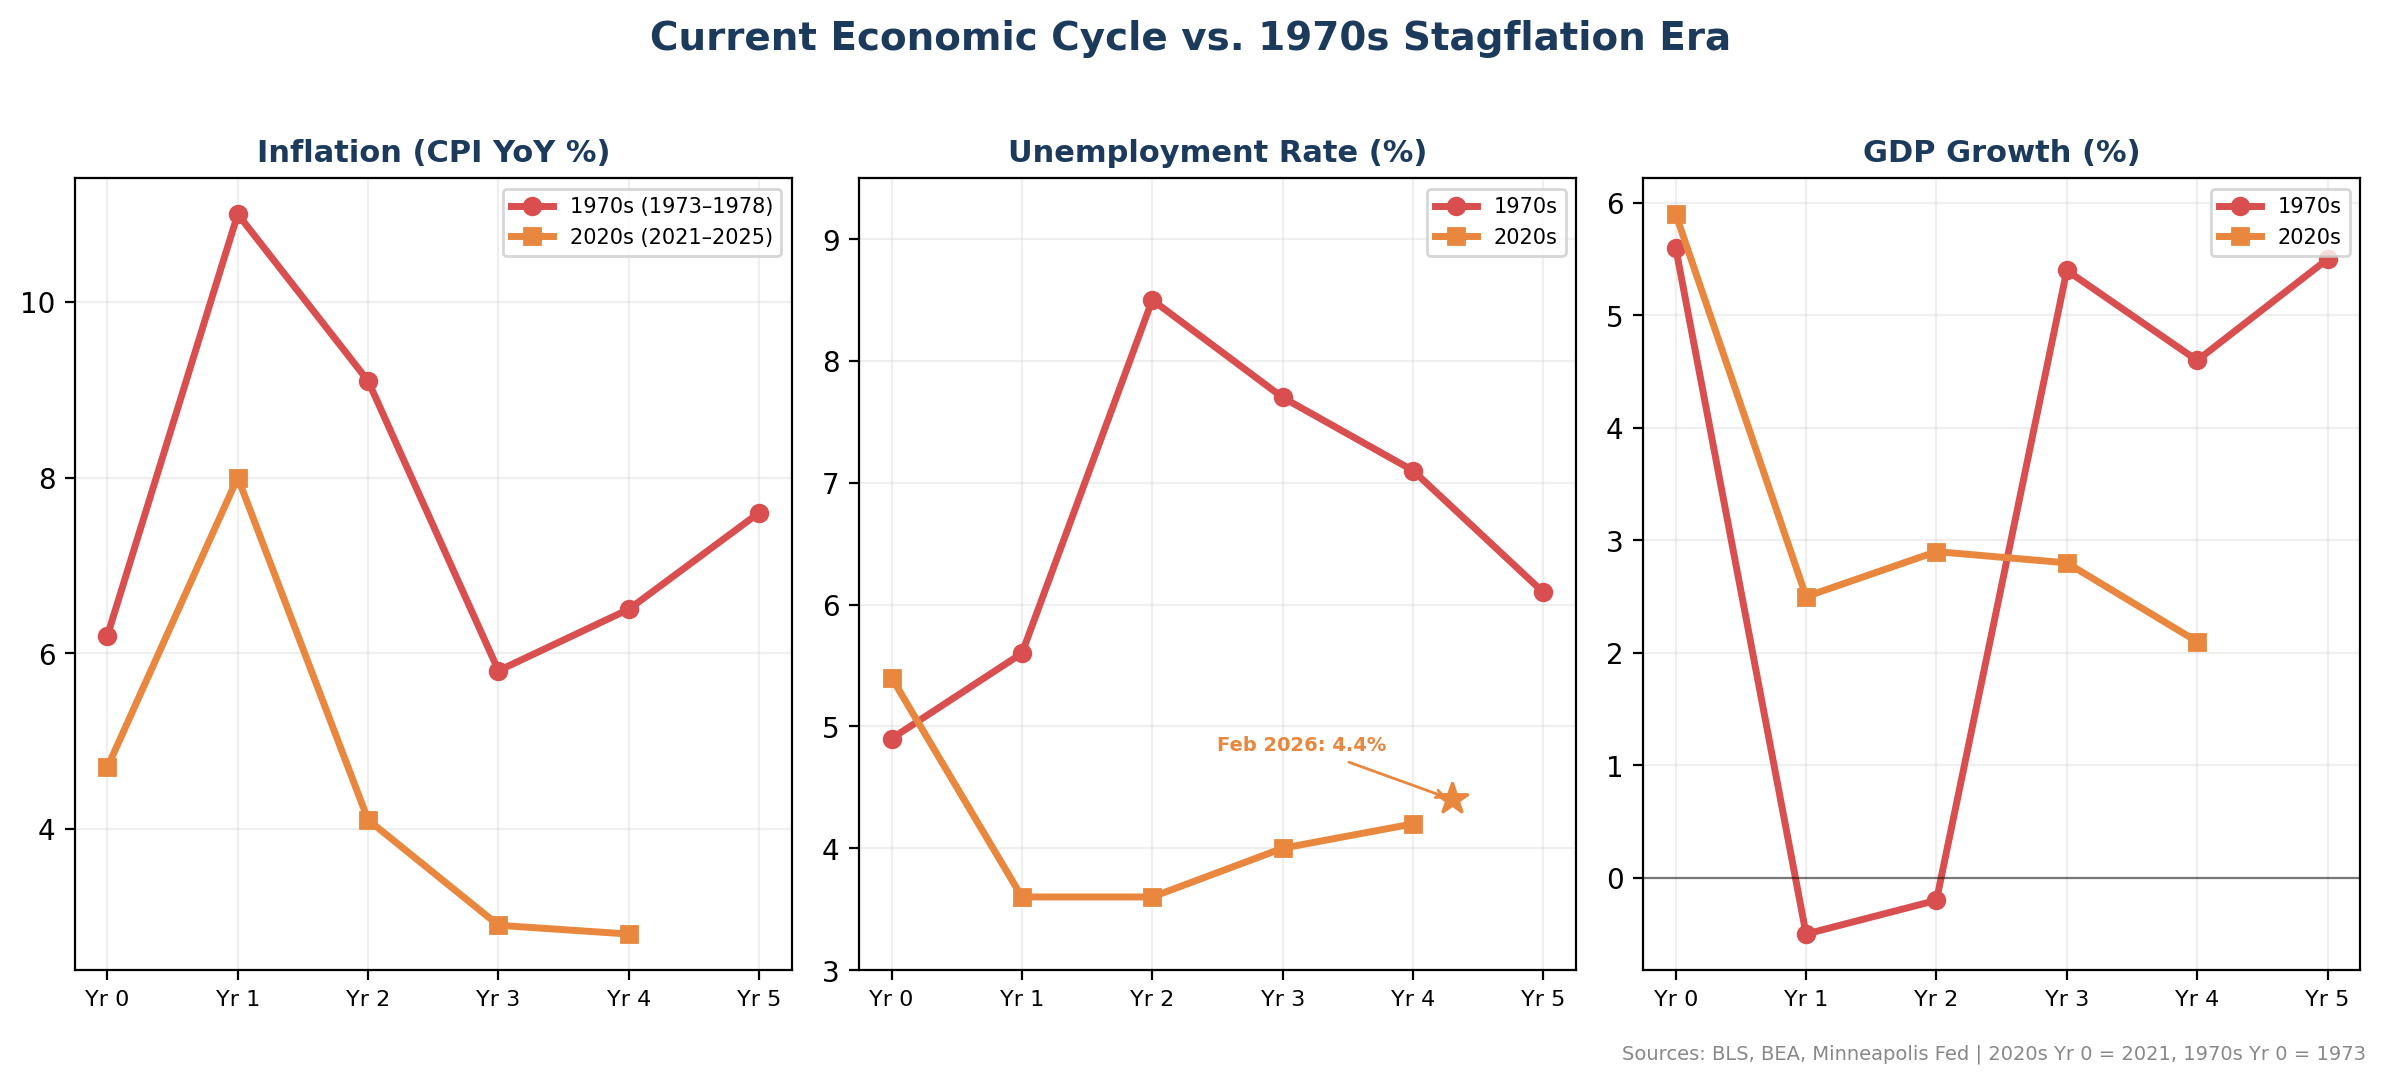
Inflation and unemployment in the 2020s cycle remain well below 1970s levels. However, the trajectory is the concern. Inflation, which had been declining, is now poised to reverse due to the oil shock (more on this later), while unemployment is trending higher. GDP growth has decelerated from 2.8% (2024) to 2.1% (2025) to an annualized 0.7% in Q4 2025. The FOMC’s March 2026 projections show the median participant expects 4.4% unemployment through year-end 2026 and revised core inflation upward for 2026 and 2027.
The Tariff Saga & SCOTUS Ruling
The original article mentioned tariffs as a potential driver of inflation. What unfolded was far more dramatic than most anticipated.
The 2025 Tariff Regime
Beginning in early 2025, the Trump administration imposed sweeping tariffs under the International Emergency Economic Powers Act (IEEPA), targeting China, Canada, Mexico, and eventually most other trading partners with “reciprocal” tariffs. The effective U.S. tariff rate climbed from 2.7% (the 2022–2024 average) to 9.9% by December 2025. Yale’s Budget Lab estimated the tariffs raised approximately $194.8 billion in customs revenue above baseline.
The inflationary passthrough was significant. Imported consumer goods prices (PCE core goods) rose 1.3–2.0% during 2025, directly attributable to tariffs. EY modeled the tariffs as creating a “stagflationary shock,” estimating a 1-percentage-point drag on GDP growth in 2025 and an additional 0.4 percentage points in 2026. The CBO estimated the tariffs would increase the PCE price index by roughly 0.4 percentage points annually over 2025–2026.
SCOTUS Strikes Down IEEPA Tariffs
On February 20, 2026, the Supreme Court ruled 6–3 in Learning Resources, Inc. v. Trump that IEEPA does not authorize the President to impose tariffs. Chief Justice Roberts, writing for the majority, emphasized that tariff power is “very clearly a branch of the taxing power” reserved for Congress under Article I. The ruling invalidated the reciprocal tariffs, fentanyl-related tariffs, and baseline tariffs imposed under IEEPA authority.
Within hours, President Trump signed an executive order terminating IEEPA tariffs and simultaneously imposed a 10% global tariff under Section 122 of the Trade Act of 1974. This statute limits such tariffs to 150 days without congressional approval. The effective tariff rate dropped from approximately 17% to roughly 6.7 percentage points above pre-2025 levels. Section 232 tariffs on steel, aluminum, automobiles, and other products remain in effect, as do Section 301 tariffs on China.
The ruling also created a potential refund liability: Importers who paid IEEPA tariffs ($142 billion+ collected in 2025 alone) may be entitled to reimbursement. However, the mechanics remain unresolved, and the administration has signaled it will contest refunds in court. Yale’s Budget Lab estimates that the temporary positive fiscal impulse from IEEPA refunds may offset the negative growth impacts of the remaining tariffs in 2026.
The Iran War — A 1970s Parallel
If there is one development that makes the 1970s comparison genuinely alarming, it is the U.S.-Israeli war with Iran that began on February 28, 2026. The parallels to the 1973 oil embargo that triggered the original stagflation era are striking.
The Oil Shock
Iran responded to U.S. and Israeli strikes by effectively closing the Strait of Hormuz, a transit point for roughly 20 million barrels of oil per day, approximately one-fifth of global petroleum consumption.
Oil prices have surged by more than 25% since the war began. Brent crude oil crossed $100 per barrel for the first time since Russia’s 2022 invasion of Ukraine, peaking near $115 in late March before retreating. The national average retail gasoline price crossed $4 per gallon by late March—up more than $1 from pre-war levels. Diesel hit $5.45, a 45% increase. As of April 1, Brent is trading around $101–$105, down sharply after President Trump signaled the U.S. military could wind down operations within “two or three weeks.” The EIA projects Brent will remain above $95 through Q2 before falling below $80 in Q3 2026, but that assumes a resolution to hostilities.
Economists have raised inflation forecasts significantly—various sources now project it is a full percentage point above February’s 2.4%. Analysts warned that a prolonged Hormuz closure could keep oil above $100 and push gasoline past $3.50 nationally — both thresholds already surpassed.
The Stagflation Feedback Loop
The combination of weak hiring (the economy shed 92,000 jobs in February, before the war began) and the oil-driven inflationary impulse creates precisely the policy nightmare the Fed has sought to avoid.
The Fed held rates steady at 3.50–3.75% in March 2026 and projected only a single rate cut for the year. Markets had been pricing in 50 basis points of easing for 2026, but the war has created uncertainty about whether the Fed will prioritize fighting inflation or supporting the labor market. Every major oil shock in history—1973, 1979, 2008—has been followed by recession.
For CRE investors, this is the critical variable to watch. If the conflict ends quickly and oil prices retreat, the stagflation threat may remain a near-miss. If it drags on and energy prices stay elevated, the U.S. could find itself in a genuine stagflationary environment for the first time in over 40 years.
CRE Returns During Stagflation
It was challenging to find data on how commercial real estate was affected during the 1970s and 1980s, aside from anecdotal claims that CRE outperformed other asset classes such as stocks and bonds.
The best historical CRE indicator I could find was NAREIT's FTSE All Equity REIT Index. Per FTSE RUSSELL (opens as a PDF), today's subsector breakdown is the following:
Apartments 9.60%
Data Centers 10.55%
Diversified 1.64%
Free Standing 5.51%
Gaming REITs 3.23%
Health Care 13.35%
Industrial 12.01%
Lodging/Resorts 2.51%
Manufactured Homes 2.17%
Office 3.64%
Regional Malls 4.58%
Self-Storage 6.77%
Shopping Centers 5.42%
Single Family Homes 2.28%
Specialty 3.58%
Telecommunications REITs 10.94%
Timberland REITs 2.21%
A diversified mix of asset classes is included in the index.
There has been tracking since 1971, and while the composition is undoubtedly different today than it was 50 years ago, it still provides a valuable history of real estate performance during turbulent economic times.
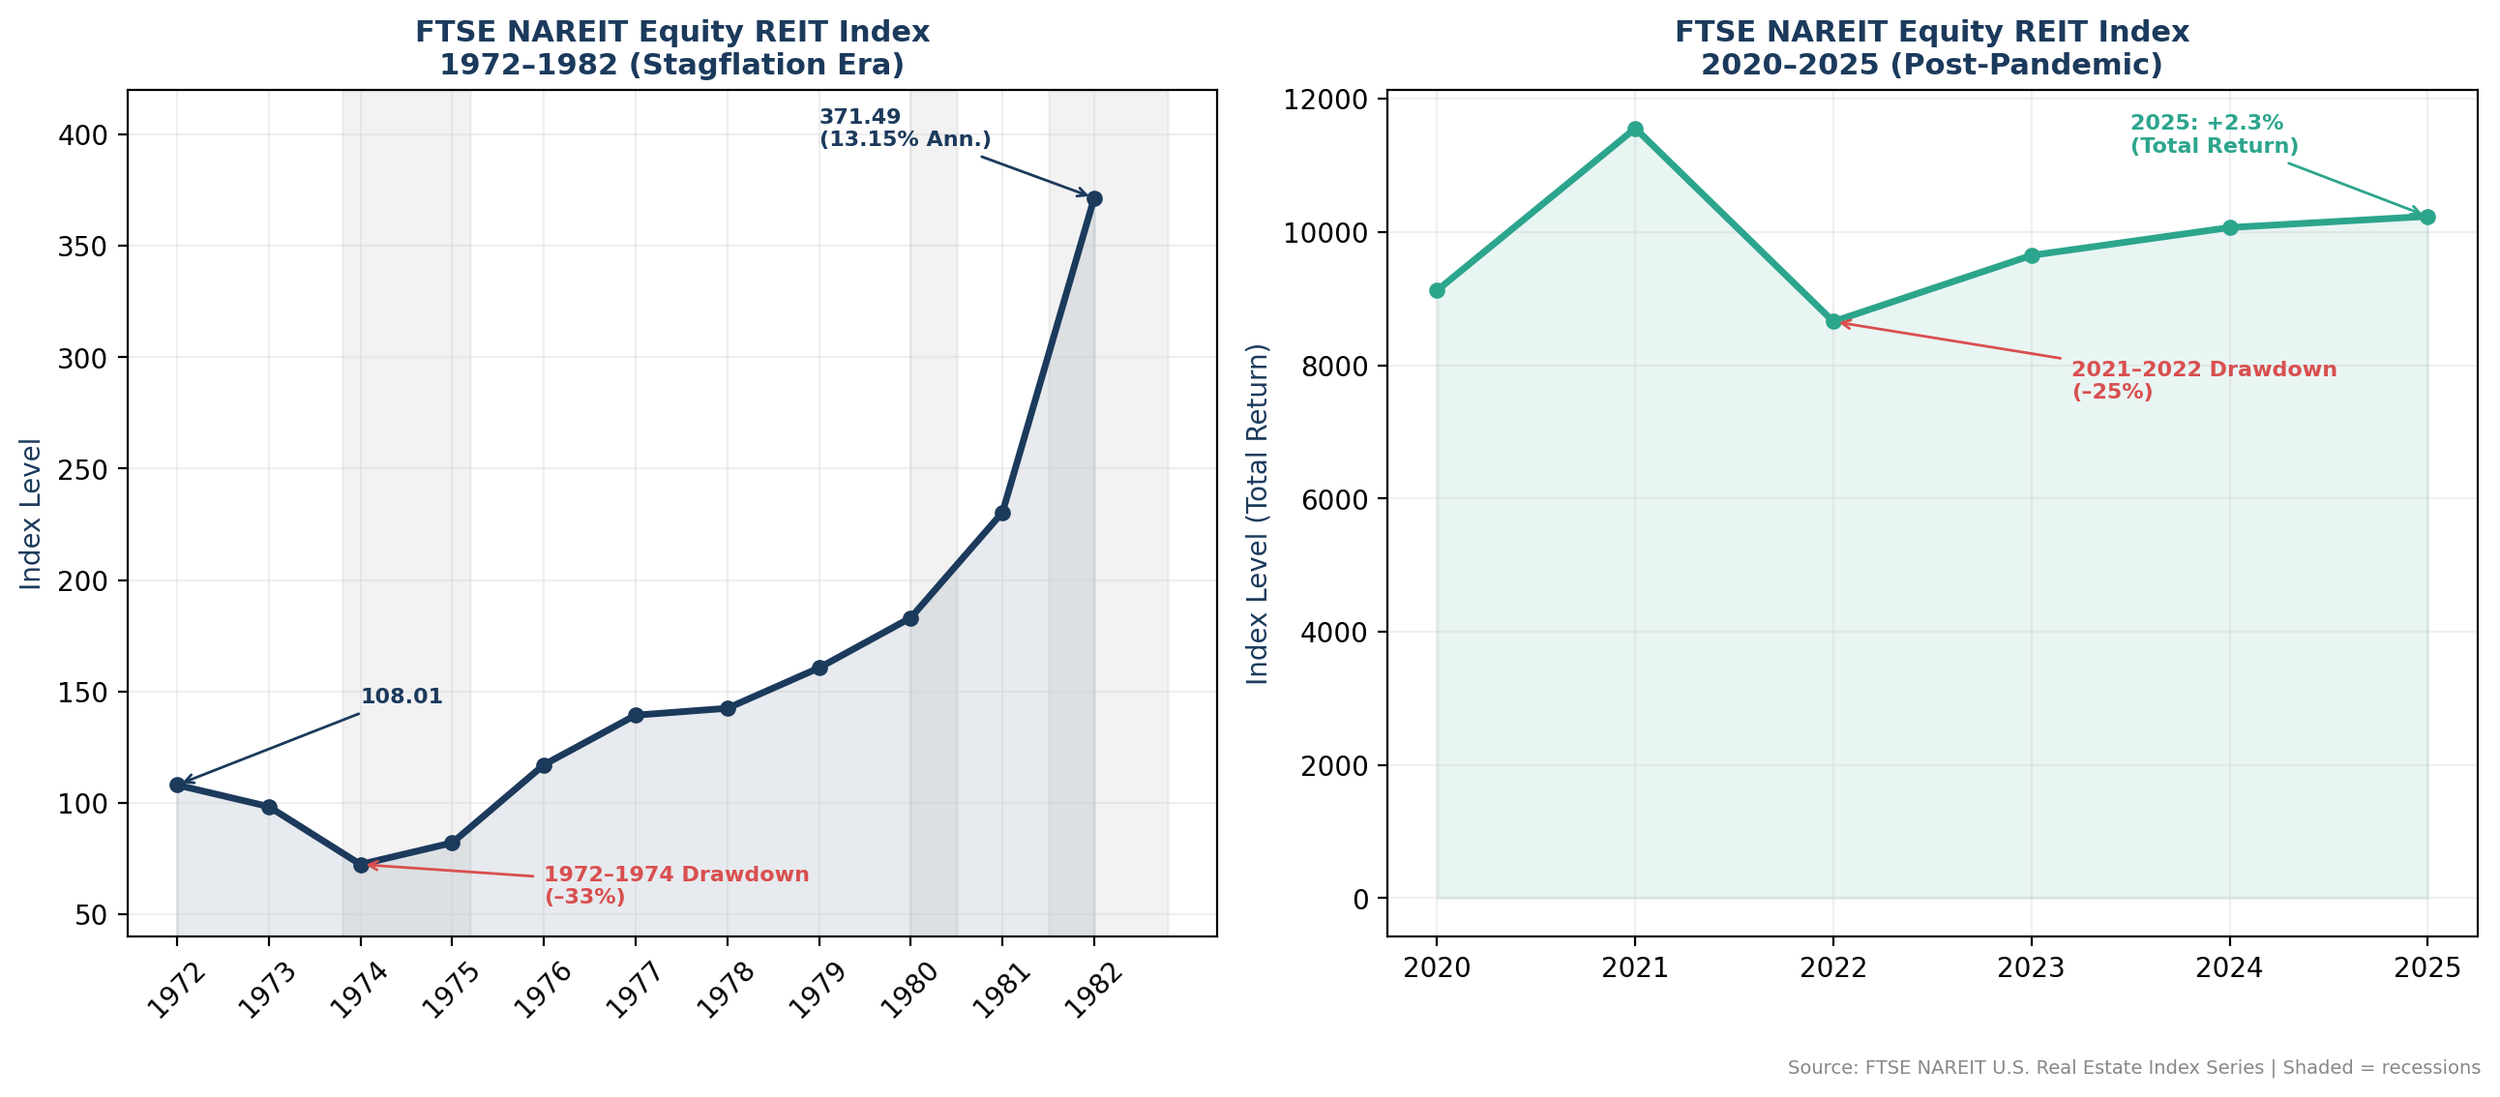
From 1972-1982, the index moved from 108.01 to 371.49, a 13.15% annualized return.

According to data from minneapolisfed.org, the annualized inflation rate over the same period averaged 8.71%.
The REIT basket boasted about a +4.44% clearance over inflation during that period.
S&P 500 During Stagflation
How did stocks perform over this period?
I used the S&P 500 calculation provided by dqydj.com. The S&P 500 gained only 1.7% annually from December 1972 to December 1982, well below the inflation rate. This return doesn't include dividend reinvestment, which would have impacted total returns materially over a decade. Including dividend reinvestment, the returns jumped to 6.5% annually, an improvement, but still below the inflation rate.
2020–2025 REIT Performance
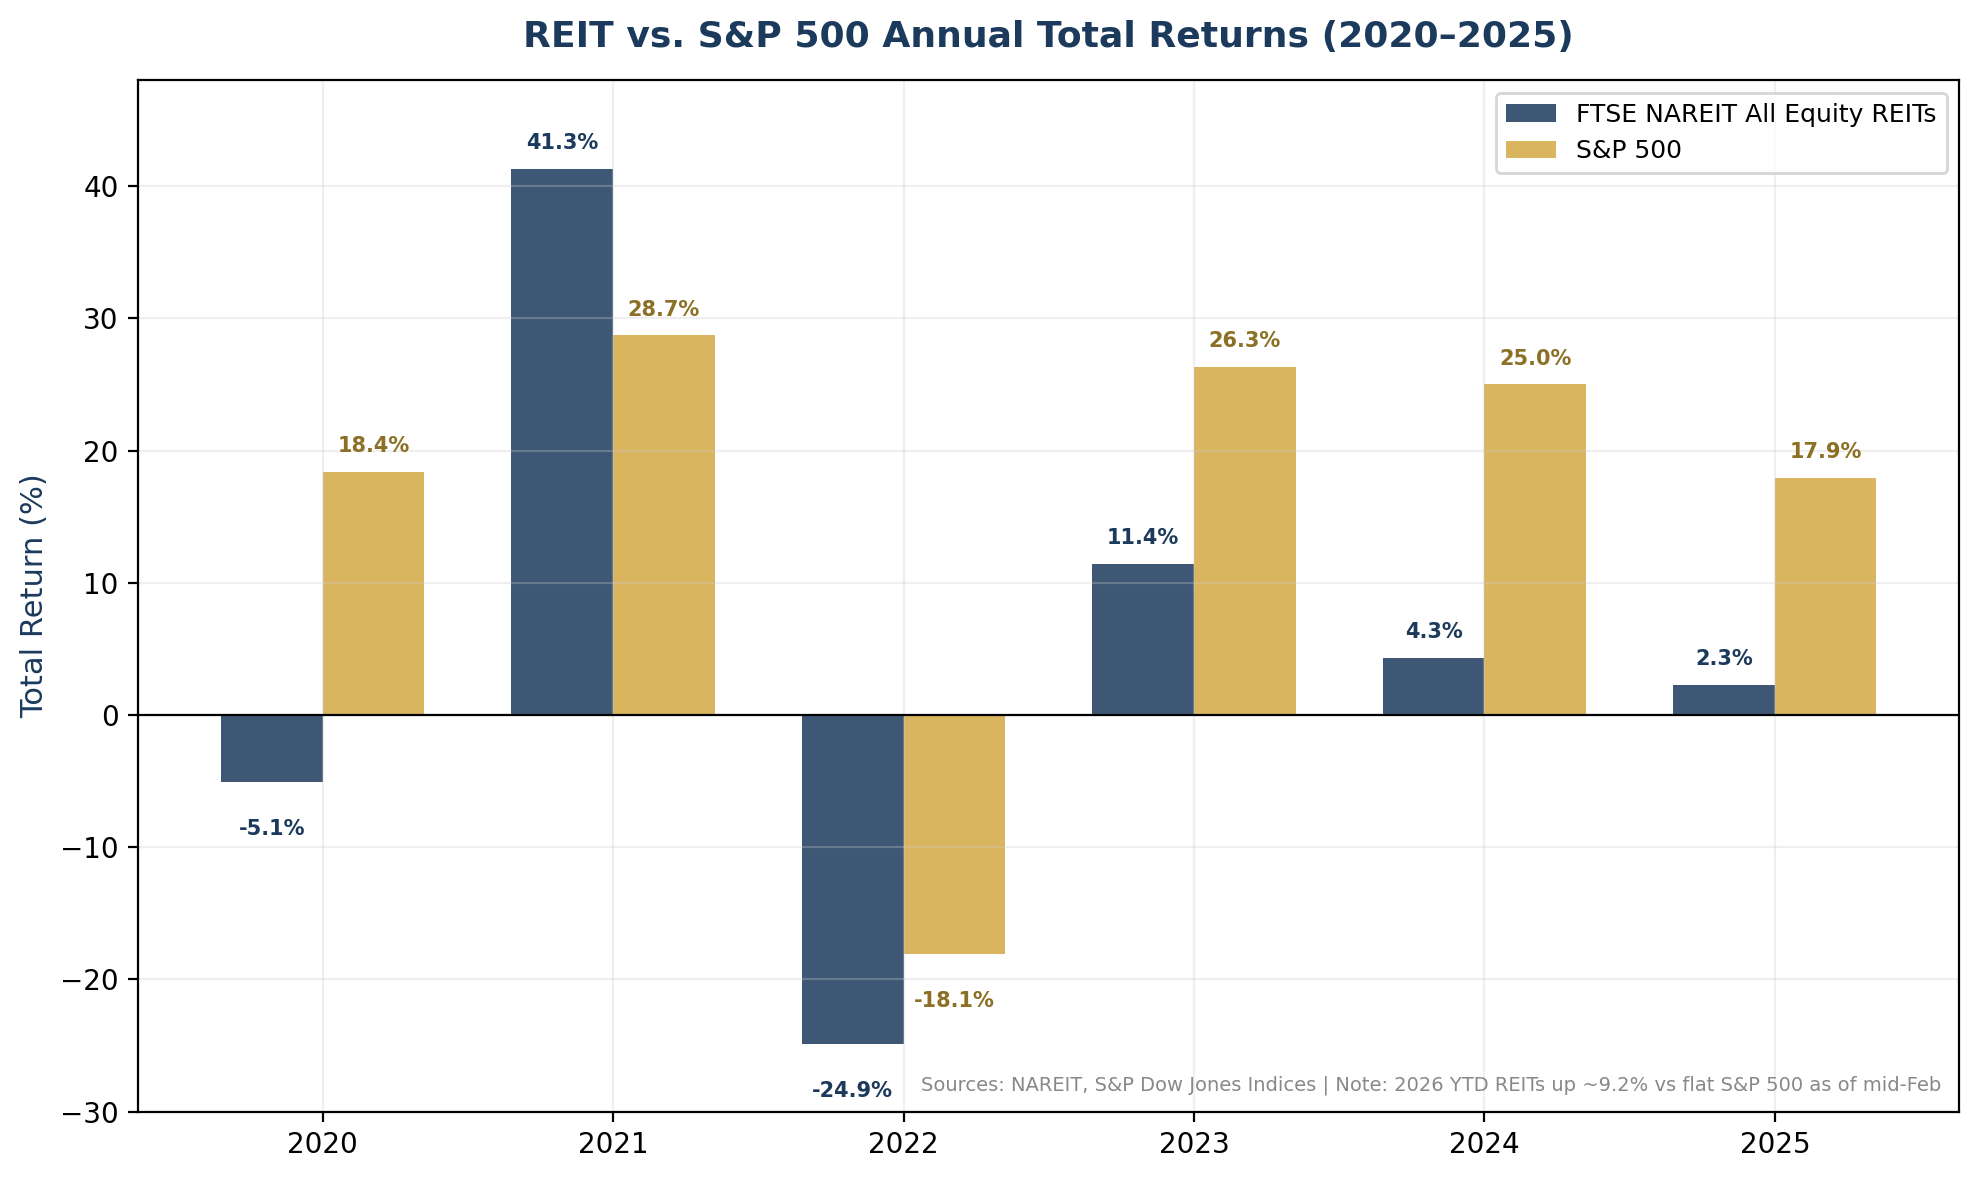
REITs have had a turbulent run during this cycle. After a massive 41.3% rally in 2021, the FTSE NAREIT All Equity REITs Index plunged 24.9% in 2022 as the Fed aggressively raised rates. The recovery has been uneven: +11.4% in 2023, +4.3% in 2024, and just +2.3% in 2025. Meanwhile, the S&P 500 returned 17.9% in 2025, driven by enthusiasm for AI and mega-cap tech.
Early 2026: The Reversal Begins?
Interestingly, early 2026 has seen a sharp reversal. As of mid-February 2026 (before the Iran war), the FTSE NAREIT All Equity REITs Index delivered total returns of approximately 9.2% year-to-date, sharply outpacing a flat S&P 500. Data center REITs led the way with a ~22% surge, reversing their 14% decline in 2025. Nareit projects that two major valuation gaps—between public and private real estate, and between REITs and broader equities—are poised to close, historically a precursor to REIT outperformance.
This mirrors the 1970s pattern remarkably well. The REIT index was down 33% from 1971 to 1974, but then appreciated annually through 1982. REITs today, having already suffered the rate-hiking drawdown, may be similarly positioned to outperform in a stagflationary environment—particularly if the oil shock drives investors toward real asset classes with inflation-hedging characteristics.
REIT Operational Fundamentals
REITs entered 2026 with strong operational fundamentals. Funds from operations (FFO) grew 6.2% in 2025, dividends grew 6.3%, and the sector maintains low leverage with reliable access to capital. The FTSE NAREIT All Equity REITs dividend yield stood at 4.07% as of year-end 2025, compared to just 1.10% for the S&P 500. This income component—a key differentiator during inflationary periods—positions REITs as an attractive inflation hedge if stagflation materializes.
Stagflation Impact on Multifamily Investing
Here are a few ways multifamily investing could be impacted during prolonged stagflation.
Transaction & Development Scarcity
The original article predicted that prolonged stagflation would cause properties to sell only in distress. This has partially played out. Transaction volumes were depressed in 2024–2025 due to high interest rates and bid-ask spreads. However, CBRE forecasts a 16% increase in investment activity in 2026 (to $562 billion), and Colliers projects a 15–20% increase in sales volume as institutional and cross-border capital re-enters the market.
The key headwind: a massive $1.8 trillion wall of maturing commercial debt. Deals underwritten aggressively during the 2021–2022 low-rate era are coming due in a higher-rate environment. This creates both distressed opportunities and transaction pressure. The government-sponsored enterprises (GSEs) received a 20.5% increase to their multifamily lending caps for 2026, providing critical liquidity.
Rent Demand & Supply Dynamics
Barriers to homeownership continue to fuel rental demand. Per CBRE, the monthly premium to buy versus rent is 105%. There is an estimated shortage of 3.4 million single-family homes. More than half of the $13 trillion in outstanding mortgages were financed below 4%, locking homeowners in place and supporting multifamily lease renewals (57% of all leasing activity, up from 48% in 2005).
However, if the oil shock triggers a genuine recession, renter demand could weaken as job losses mount and household formation slows. CBRE notes that softening demand, driven by tepid job growth, is expected to continue in the first half of 2026. Operators are prioritizing occupancy over rent growth, offering significant concessions on new leases.
Winners & Losers by Location
The original article flagged that specific industries and locations would struggle more than others. This is playing out clearly, and data from the Tactica RES Market Data Explorer confirms the divergence.
Oversupplied Sun Belt markets entered 2026 in a vulnerable position, which is exactly where you don't want to be heading into a potential stagflation cycle. National apartment vacancy hit 7.4% in early 2026, but the pain is concentrated: Cape Coral and Naples, FL, sit at 11.3%; Austin at 9.7%; San Antonio at 9.5%; Dallas-Fort Worth at 9.0%; and Denver at 8.9%. Every metro with a supply-to-stock ratio above 4% is posting above-average vacancy, and every one of the 25 highest-vacancy metros is posting negative year-over-year rent growth. Austin's pipeline alone delivered over 15,000 permitted units at a 6.04% supply ratio, more than triple the national median of 1.95%. If stagflation materializes and job losses mount, these markets have no cushion. Operators are already offering concessions just to maintain occupancy. A recession on top of a supply glut would significantly compound pressure on NOI.
Midwest and select secondary markets offer a different setup entirely, and one that historically holds up better when the economy softens. Research on the most affordable rental markets with actual population growth identified metros like Huntsville, AL (7.25x wage-to-rent ratio, 2.9% population growth, 1.9% unemployment), Des Moines, IA (6.26x, +2.3% population growth), Lincoln, NE (5.62x, +2.4% population growth), and Knoxville, TN (5.49x, +3.0% employment growth). These markets combine moderate supply pipelines with affordability headroom, meaning residents can absorb inflation-driven cost increases without being priced out. In a stagflation scenario where rents face downward pressure nationally, markets with low vacancy, constrained supply, and affordable rents relative to wages have the widest margin of safety.
Workforce housing (Class B and C multifamily) could be the strongest-performing asset class if stagflation takes hold. When rising energy costs and stagnant wages squeeze household budgets, renters may trade down. Demand could shift from Class A to Class B and C, and markets where median rents remain below $1,200 with wage-to-rent ratios above 5.5x are best positioned to capture that migration.
Energy-dependent markets face the most unpredictable risk profile in a stagflation scenario driven by an oil shock. Higher oil prices benefit some energy-producing regions in the short term, but the 1970s showed that prolonged energy crises eventually drag down even energy-producing economies as consumer spending collapses and the broader recession takes hold. Multifamily investments in submarkets tied to travel, hospitality, and manufacturing may see reduced renter demand before energy-belt markets feel the pain.
Inconsistent Operations
The original prediction that inflation would wreak havoc on operating expenses has been validated. Insurance costs, payroll, and materials have continued to rise. Construction inputs are now more than 40% higher than in early 2020. If the oil shock persists, energy costs for property operations will become another significant headwind. Diesel price increases have already begun flowing through to maintenance, landscaping, and supply delivery costs.
On the revenue side, the war in Iran introduces a new risk factor. If surging energy costs accelerate inflation while simultaneously weakening the job market, bad debt could rise as residents face the dual pressures of unemployment and higher fixed expenses. Newmark Research’s characterization of the 2026 environment as “decaf stagflation”—below-trend growth with stubborn inflation—captures this dynamic well, though a prolonged conflict could turn it into full-strength stagflation.
Summarizing the Stagflation Threat
When this article was first published in February 2024, the U.S. was “far from stagflation territory.” That assessment is no longer as clear-cut.
What has gotten worse:
GDP growth decelerated sharply (0.7% annualized in Q4 2025)
Nonfarm payrolls fell 92,000 in February 2026; unemployment was at 4.4% and trending higher
The Iran war has caused a major oil shock, with Brent above $100 and gas above $4/gallon
Inflation, which had been declining, is expected to reverse course in the March 2026 data
What has improved or stabilized:
Pre-war inflation had fallen to 2.4% (Feb 2026), near the Fed’s target
SCOTUS struck down the most disruptive tariffs, reducing the effective tariff rate significantly
REITs have begun outperforming equities in early 2026 (+9.2% YTD vs. flat S&P 500)
Multifamily vacancy appears to have peaked, and new supply is slowing
The key variable: Iran
If the Iran conflict ends quickly and the Strait of Hormuz reopens, oil prices should retreat, the inflationary impulse will be temporary, and the U.S. will likely avoid true stagflation.
